Consumer Report Card — Week of March 17, 2025

Essential Economics
— Mark Frears
Report card
Do you remember your GPA in high school? Was it a big deal then? Probably, but not so much now. When we looked back at some of my old reports, the consistent theme was that I was reading too much. Some things don’t change! The other “old school” practice was that you had to bring your report card home, for the parents to view and sign. Amazingly, some kids’ evaluations never made it home.
How does the report card look on the U.S. consumer? Are they making the expected grades? Let’s take a look.
Survey Says
The Federal Reserve Bank of New York’s Center for Microeconomic Data published their February 2025 Survey of Consumer Expectations (SCE), and the outlook is less rosy than the prior month. There are three parts to the survey: reading, writing and arithmetic. No, sorry: inflation, labor market and household finance.
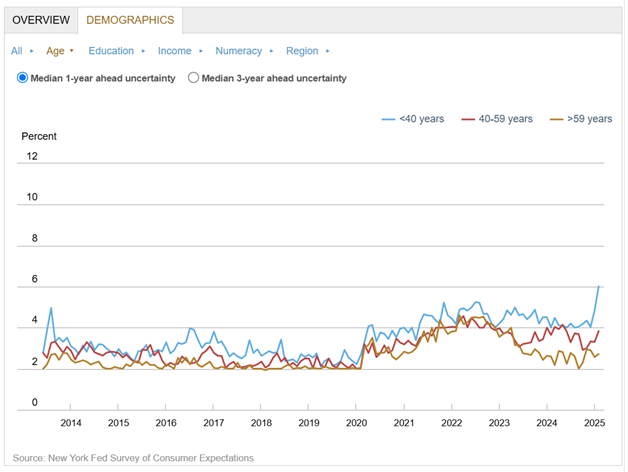
On the inflation expectations, they are looking out one, three and five years, with all three hovering around 3%. As far as inflation uncertainty, this increases across all three timeframes. Interestingly, as seen below, the uncertainty is highest in the younger age brackets.
If we look at the labor market and specifically the ability to find another job, we can see the dispersion by income level below.
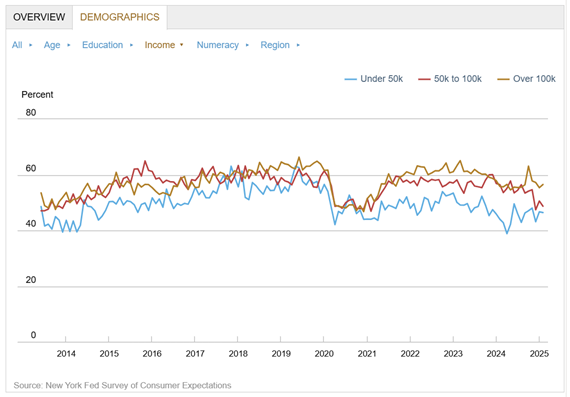
As you can see, the higher your income bracket, the better you feel about finding a new job in the next three months if you lose your job today. This has been true going back to the pandemic.
There is more discussion about consumers not being able to make ends meet, especially at the lower end of the income spectrum. As you can see below, households with under $50,000 income have a 20% probability of not being able to make minimum debt payments over the next three months
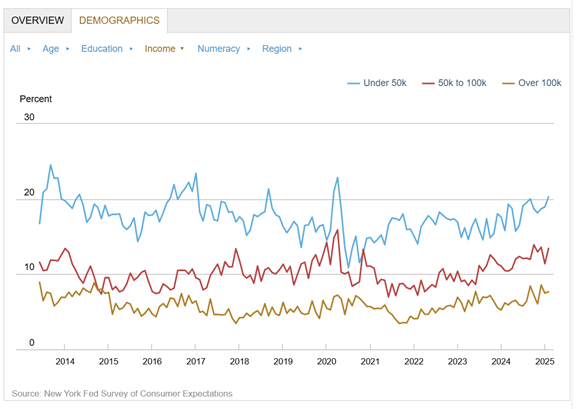
All three income levels see increasing odds of missing a payment. Not a good grade in this area.
Deeper dive
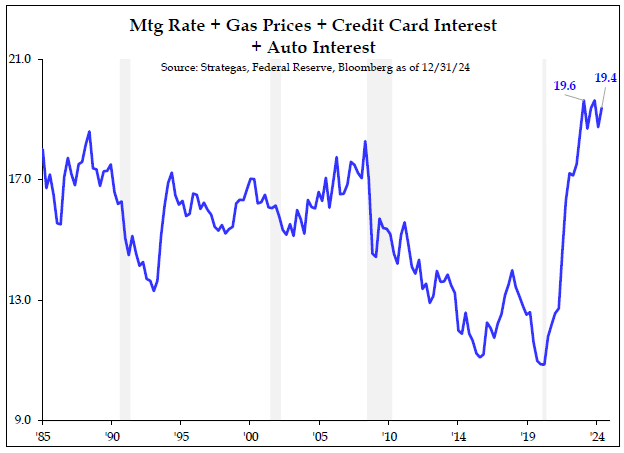
The stress on the consumer is real. When your fixed expenses take up more and more of your budget, you have to resort to credit cards. As seen below, credit card interest is running above levels seen during the Great Recession.
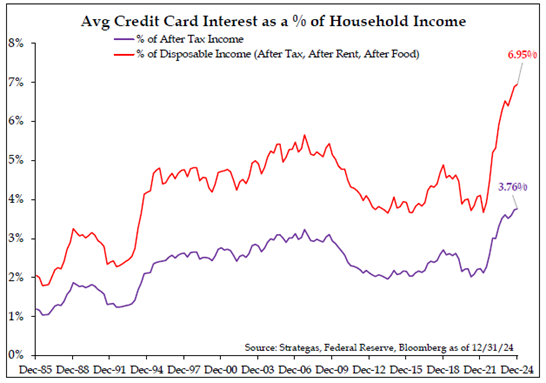
Taking this to a broader picture, we see below that stress on the consumer budget is running higher than any time since the mid-1980s. This trend cannot continue.
As you would expect, this is flowing through to non-payments. The charts below show the impact on credit cards and auto loans.
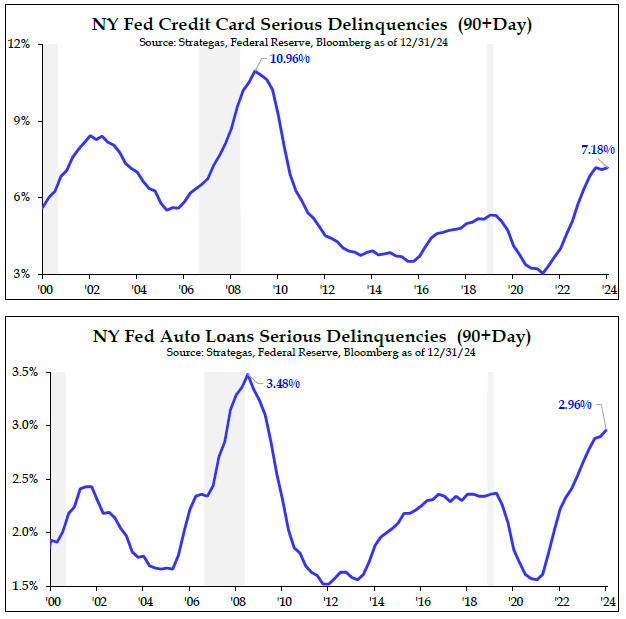
While the SCE only shows minor stress for the consumer, if you look under the surface, C and D grades could be on the report card next semester.
Economic releases
Last week saw inflation metrics come in lower than expected, but the consumer sentiment shows future rates are going higher, and it is impacting their outlook.
This week’s calendar has retail sales, housing starts, building permits, leading index and existing home sales. In spite of those releases, the focus will be on the FOMC meeting ending on Wednesday. We will also get updated Summary of Economic Projections and the Dot Plot. See below for more detail.
Wrap-Up
I fully acknowledge that grades are not the only measure of academic achievement, but they are a significant indicator. We are dealing with two different consumer sectors currently, but the negative reports coming out could bleed into the broader economy before long.
| Upcoming Economic Releases: | Period | Expected | Previous | |
|---|---|---|---|---|
| 17-Mar | Empire Manufacturing | Mar | (1.9) | 5.7 |
| 17-Mar | Retail Sales MoM | Feb | 0.6% | -0.9% |
| 17-Mar | Retail Sales ex Autos MoM | Feb | 0.3% | -0.4% |
| 17-Mar | Business Inventories | Jan | 0.3% | -0.2% |
| 17-Mar | NAHB Housing Market Index | Mar | 42 | 42 |
| 18-Mar | Building Permits | Feb | 1,450,000 | 1,473,000 |
| 18-Mar | Building Permits MoM | Feb | -1.6% | -0.6% |
| 18-Mar | Housing Starts | Feb | 1,381,000 | 1,366,00 |
| 18-Mar | Housing Starts MoM | Feb | 1.1% | -9.8% |
| 18-Mar | NY Fed Services Business Activity | Mar | N/A | (10.5) |
| 18-Mar | Industrial Production MoM | Feb | 0.2% | 0.5% |
| 18-Mar | Capacity Utilization | Feb | 77.8% | 77.8% |
| 19-Mar | FOMC Rate Decision (Upper Bound) | 1p CT | 4.50% | 4.50% |
| 19-Mar | FOMC Rate Decision (Lower Bound) | 1p CT | 4.25% | 4.25% |
| 19-Mar | FOMC SEP & Dot Plot updated | 1p CT | ||
| 20-Mar | Initial Jobless Claims | 15-Mar | 224,000 | 220,000 |
| 20-Mar | Continuing Claims | 8-Mar | 1,888,000 | 1,870,000 |
| 20-Mar | Philadelphia Fed Business Outlook | Mar | 1,861,000 | 1,867,000 |
| 20-Mar | Leading Index | Feb | 0.2% | -0.3% |
| 20-Mar | Existing Homes Sales MoM | Feb | -3.4% | -4.9% |
| 20-Mar | Existing Home Sales | Feb | 3,940,000 | 4,080,000 |
Mark Frears is a Senior Investment Advisor, Managing Director, at Texas Capital Bank Private Wealth Advisors. He holds a Bachelor of Science from The University of Washington, and an MBA from University of Texas – Dallas.
The contents of this article are subject to the terms and conditions available here.
Texas Capital Private Bank™ refers to the wealth management services offered by the bank and non-bank entities comprising the Texas Capital brand, including Texas Capital Bank Private Wealth Advisors (PWA). Nothing herein is intended to constitute an offer to sell or buy, or a solicitation of an offer to sell or buy securities.
Investing is subject to a high degree of investment risk, including the possible loss of the entire amount of an investment. You should carefully read and review all information provided by PWA, including PWA’s Form ADV, Part 2A brochure and all supplements thereto, before making an investment.
Neither PWA, the Bank nor any of their respective employees provides tax or legal advice. Nothing contained on this website (including any attachments) is intended as tax or legal advice for any recipient, nor should it be relied on as such. Taxpayers should seek advice based on the taxpayer’s particular circumstances from an independent tax advisor or legal counsel. The wealth strategy team at PWA can work with your attorney to facilitate the desired structure of your estate plan. The information contained on this website is not a complete summary or statement of all available data necessary for making an investment decision, and does not constitute a recommendation. The information has been obtained from sources considered to be reliable, but we do not guarantee that the foregoing material is accurate or complete. Any opinions are those of the authors and not necessarily those of PWA or the Bank.
©2025 Texas Capital Bank Wealth Management Services, Inc., a wholly owned subsidiary of Texas Capital Bank. All rights reserved.
Texas Capital Bank Private Wealth Advisors and the Texas Capital Bank Private Wealth Advisors logo are trademarks of Texas Capital Bancshares, Inc., and Texas Capital Bank.
www.texascapitalbank.com Member FDIC NASDAQ®: TCBI