Managing expectations — Week of April 28, 2025

Essential Economics
— Mark Frears
Are you ready?
Do you like surprises? Guess that may depend on whether they are positive or negative. It is not pleasant to walk into your house after a week’s vacation and find the water heater leaked, but it can be fun to walk into the laundry room and find the wash has been done! (And the detergent worked.) Some would rather not have any unexpected events, while others would think that was boring. Different strokes for different folks.
Economic releases tell the story of the underlying strength or weakness of the country or region. There is an entire universe of people dedicated to predicting/forecasting these metrics. How good are they?
Data
Do you think the markets like surprises? Again, positive ones should be a good thing. Yes, there is an indicator for that; the Citigroup US Economic Surprise Index. As you can see below, 2020 had a big pop, but in 2025, we have been trending down, until the last month.
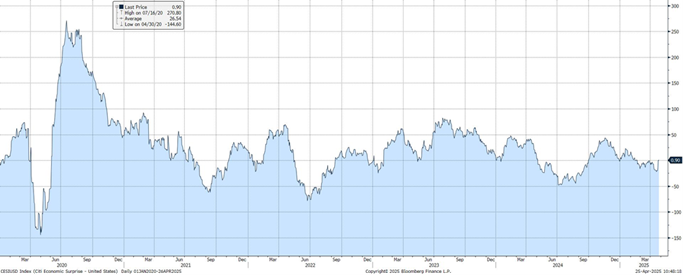
To clarify, this is not measuring economic strength. This shows us how actual data compares to the analyst’s expectations/predictions for the releases. For example, if the analyst’s prediction for nonfarm payroll is an addition of 300,000 workers, and the actual is 200,000, this is a significant “surprise” or miss on the actual versus forecast. This would be a negative impact on the Index, as it is below expectations.
As you can see in the chart for 2020, early on there were many negative readings, as analysts could not accurately predict releases. In mid-2020, the readings were positive, as prognosticators underestimated the economic indicators. More recently, the surprises have been more stable, but we are on a downtrend since Q3 2024, meaning the releases have been lower than expected.
One thing this index can show us is momentum of the economy. If it is in a negative trend, like recently, it can show that the actuals are disappointing versus the forecast and foretell a slowing economy. One more thing for you to monitor as you wade through the myriad of economic news.
Across the pond
Considering the increasing global focus, let’s look at how this index works in Europe. As you can see below, the U.S. index shows more unexpected releases than Europe. This is the first time since early February.
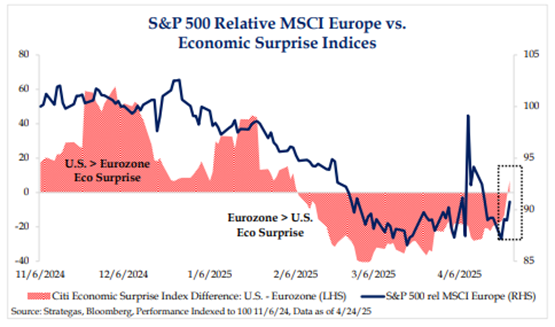
While we saw better equity results out of the international sector earlier this year, the trend may now be changing.
Hard versus soft
Another thing to watch on economic releases is whether they are actual numbers, as opposed to confidence/sentiment indicators. Hard data continues to show a growing economy, but as soon as a positive number comes out, economists are looking at that as “history,” or prior to tariff impact. So, hard data is being discounted, and soft data (confidence or sentiment) is much lower, primarily due to the uncertainty of the economic and political environment. Stay tuned to see if positive hard data continues.
Economic releases
Last week had decent hard data with durables and new home sales. Soft data weaker with Consumer Sentiment flirting with recessionary levels.
This week’s calendar is packed, with Q1 GDP and payroll releases topping the charts. See below for details.
Wrap-Up
In my mind, surprises are a good thing. Even if it may not initially appear to be in your best interests, if you step back and consider all the different things that could come from your negative surprise, there just may be a silver lining. I’m not saying I always have that outlook, but I’m attempting to keep the glass half full!
| Upcoming Economic Releases: | Period | Expected | Previous | |
|---|---|---|---|---|
| 28-Apr | Dallas Fed Manuf Activity | Apr | (14.1) | (16.3) |
| 29-Apr | Retail Inventories MoM | Mar | 0.3% | 0.1% |
| 29-Apr | Wholesale Inventories MoM | May | 0.7% | 0.3% |
| 29-Apr | FHHA House Price Index MoM | Feb | 0.3% | 0.2% |
| 29-Apr | S&P CoreLogic 20-city YoY | Feb | 4.70% | 4.67% |
| 29-Apr | JOLTS Job Openings | Mar | 7,500,000 | 7,568,000 |
| 29-Apr | Conf Board Consumer Confidence | Apr | 87.6 | 92.9 |
| 29-Apr | Conf Board Present Situation | Apr | N/A | 134.5 |
| 29-Apr | Conf Board Expectations | Apr | N/A | 65.2 |
| 29-Apr | Dallas Fed Services Activity | Apr | N/A | (11.3) |
| 30-Apr | ADP Employment Change | Apr | 124,000 | 155,000 |
| 30-Apr | GDP Annualized QoQ | Q1 | 0.4% | 2.4% |
| 30-Apr | Personal Consumption | Q1 | 1.2% | 4.0% |
| 30-Apr | GDP Price Index | Q1 | 3.0% | 2.3% |
| 30-Apr | Employment Cost Index | Q1 | 0.9% | 0.9% |
| 30-Apr | Personal Income | Mar | 0.4% | 0.8% |
| 30-Apr | Personal Spending | Mar | 0.6% | 0.4% |
| 30-Apr | Real Personal Spending | Mar | 0.5% | 0.1% |
| 30-Apr | PCE Deflator YoY | Mar | 2.2% | 2.5% |
| 30-Apr | PCE Core Deflator YoY | Mar | 2.6% | 2.8% |
| 30-Apr | Pending Home Sales MoM | Mar | 1.0% | 2.0% |
| 1-May | Challenger Job Cuts YoY | Apr | N/A | 204.8% |
| 1-May | Initial Jobless Claims | 26-Apr | 225,000 | 222,000 |
| 1-May | Continuing Claims | 19-Apr | 1,860,000 | 1,841,000 |
| 1-May | ISM Manufacturing Index | Apr | 48.0 | 49.0 |
| 1-May | ISM Manufacturing Prices Paid | Apr | 73.0 | 69.4 |
| 1-May | ISM Manufacturing Employment | Apr | N/A | 44.7 |
| 1-May | ISM Manufacturing New Orders | Apr | N/A | 45.2 |
| 1-May | Construction Spending MoM | Mar | 0.2% | 0.7% |
| 1-May | Ward's Total Vehicle Sales | Mar | 17,050,000 | 17,770,000 |
| 2-May | Change in Nonfarm Payrolls | Apr | 130,000 | 228,000 |
| 2-May | Change in Private Payrolls | Apr | 120,000 | 209,000 |
| 2-May | Unemployment Rate | Apr | 4.2% | 4.2% |
| 2-May | Avg Hourly Earnings MoM | Apr | 0.3% | 0.3% |
| 2-May | Avg Hourly Earnings YoY | Apr | 3.9% | 3.8% |
| 2-May | Labor Force Participation Rate | Apr | 62.5% | 62.5% |
| 2-May | Underemployment Rate | Apr | N/A | 7.9% |
| 2-May | Factory Orders | Mar | 4.5% | 0.6% |
| 2-May | Factory Orders ex Transportation | Mar | N/A | 0.4% |
Mark Frears is a Senior Investment Advisor, Managing Director, at Texas Capital Bank Private Wealth Advisors. He holds a Bachelor of Science from The University of Washington, and an MBA from University of Texas – Dallas.
The contents of this article are subject to the terms and conditions available here.
Texas Capital Private Bank™ refers to the wealth management services offered by the bank and non-bank entities comprising the Texas Capital brand, including Texas Capital Bank Private Wealth Advisors (PWA). Nothing herein is intended to constitute an offer to sell or buy, or a solicitation of an offer to sell or buy securities.
Investing is subject to a high degree of investment risk, including the possible loss of the entire amount of an investment. You should carefully read and review all information provided by PWA, including PWA’s Form ADV, Part 2A brochure and all supplements thereto, before making an investment.
Neither PWA, the Bank nor any of their respective employees provides tax or legal advice. Nothing contained on this website (including any attachments) is intended as tax or legal advice for any recipient, nor should it be relied on as such. Taxpayers should seek advice based on the taxpayer’s particular circumstances from an independent tax advisor or legal counsel. The wealth strategy team at PWA can work with your attorney to facilitate the desired structure of your estate plan. The information contained on this website is not a complete summary or statement of all available data necessary for making an investment decision, and does not constitute a recommendation. The information has been obtained from sources considered to be reliable, but we do not guarantee that the foregoing material is accurate or complete. Any opinions are those of the authors and not necessarily those of PWA or the Bank.
©2025 Texas Capital Bank Wealth Management Services, Inc., a wholly owned subsidiary of Texas Capital Bank. All rights reserved.
Texas Capital Bank Private Wealth Advisors and the Texas Capital Bank Private Wealth Advisors logo are trademarks of Texas Capital Bancshares, Inc., and Texas Capital Bank.
www.texascapitalbank.com Member FDIC NASDAQ®: TCBI