Yes, it’s transitory! — Week of July 17, 2023

Index
WTD
YTD
1-year
3-year
5-year
Index Level
S&P 500 Index
2.44
18.40
20.88
13.87
11.87
4,505.42
Dow Jones Industrial Average
2.29
5.30
15.12
11.23
8.97
34,509.03
Russell 2000 Small Cap
3.58
10.52
14.81
11.95
4.08
1,931.09
NASDAQ Composite
3.32
35.47
26.59
11.29
13.55
14,113.70
MSCI Europe, Australasia & Far East
4.69
15.04
26.76
9.48
5.38
2,185.31
MSCI Emerging Markets
4.13
8.70
9.13
1.57
1.76
1,020.53
Barclays U.S. Aggregate Bond Index
1.93
2.72
-0.62
-3.99
0.80
2,104.40
Merrill Lynch Intermediate Municipal
0.40
2.02
1.76
-0.60
1.81
304.85
As of market close July 14, 2023. Returns in percent.
Strategy & Positioning
— Steve Orr
Summer Break
The expected easy inflation numbers gave traders an excuse to run stocks last week. The S&P 500 hit another 52-week high and Small Caps actually led the performance parade. The current Bull run got underway in mid-May. The S&P 500 has posted positive returns in seven of the nine weeks. The June drivers were resilient job numbers and prospects for a Fed pause. Recent steady economic numbers have brought the Fed back into play, countered by trader hopes that second quarter earnings would be better than expected.
Last Wednesday’s Consumer Price Inflation report kicked risk assets into a higher gear. The 3% headline was all traders needed to add 1% or more to a number of names. We think they ignored the details at their peril. All the news was good. The National League won the least-watched All-Star game ever; market breadth, consumer sentiment and jobless claims all improved. When things are going well, keep a hand on your binoculars. There is a storm somewhere.
Yes, a war
There are at least a dozen indices used to measure inflation. In all cases the goal is to measure how much prices are changing over a time period. Low inflation just means prices are rising at a slow rate. A negative inflation reading means prices are dropping at a certain pace. June’s 3% headline inflation reading sounds very close to the Fed’s magical 2% goal. Especially in light of the year-ago reading of 9.1%. And that’s where the details get in the way of a great headline. Annualized headline numbers are calculated compared to last year’s change in prices in the same month. A very low reading after last year’s big move makes this June’s reading appear minuscule.
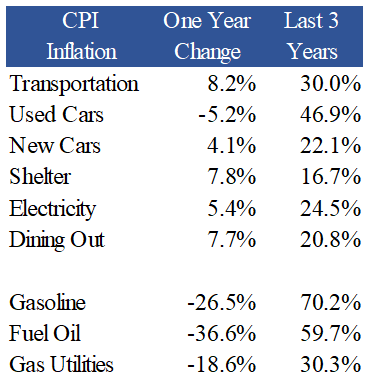
Pulling out fuel and food leaves the “Core” CPI. This index emphasizes housing, cars and healthcare. The table below shows how falling energy costs this last year helped pull down the headline. Core inflation posted a slight decrease to 4.8%. Its trailing six-month average is 5.4%.

Source: Bureau of Economic Analysis, Bloomberg, hat tip @CharlieBilello
The Fed is at war with inflation. It bears repeating: in the Fed’s thinking a mistake is having inflation rebound in a rerun of 1978–1982. Causing a recession by tightening credit and interest rates is not a mistake. One evidence of the Fed’s success would be declining job openings and rising unemployment.
Quick tour
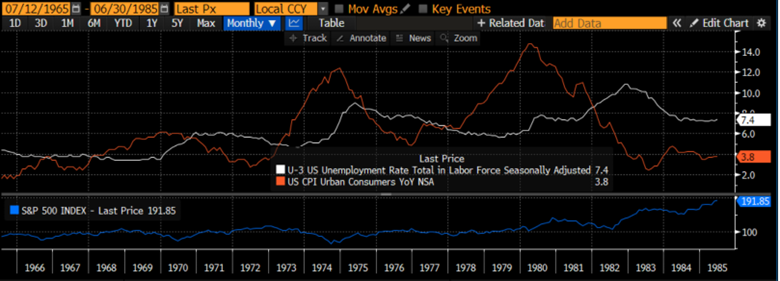
How about a quick history tour of the late ’70s? We will spare you the Nik Nik shirts and Bee Gees. The key for today is the Fed’s focus on jobs and wage inflation. The thinking is that by raising rates high enough, employers will quit hiring and wages will fall. The Fed tried that strategy back then and rising unemployment did not knock out CPI inflation.
Inflation peaked at 6% in early 1970 and unemployment reached the same level late that year. After the first Arab oil shock in 1973 (cutting supply, see above!) both series moved higher with inflation peaking five months before the unemployment rate. The third and final peak of the cycle hit in April of 1980, right after the Volker Fed moved short rates to 20%. Unemployment peaked a full two years later at 10.8%.

This is the nightmare scenario for the Fed: raising rates in mid-1974, seeing inflation drop and then declaring victory too early. The Fed cut short-term rates from 13% in 1974 to 4.875% by Halloween of 1975. Another round of oil embargoes and labor strikes helped reignite inflation. The S&P 500 peaked at the end of November 1968 at 108.4. It briefly broke above that level in late 1972 but by the end of 1973 was 15% lower. The index did not stay above 108.4 until late 1980 and then returned to that level twice in 1982. Price return over the 11-year span was near zero.
Jobs today?
Jobless claims and job openings are off their recent highs but remain elevated. If the economy is slowing towards a mild recession, then “worker hoarding” may become a thing. It is cheaper to warehouse workers than trying to find them. The scarcity of workers has given private sector unions renewed vigor.
The longshoreman deal for West Coast ports (24% wage increase in coming years) only whetted their appetite. The Teamsters has a July 31 deadline for 340,000 members to strike in August. Note that Christmas inventory begins to filter into supply chains in August. The UAW’s negotiations with the Big 3 automakers are also on tap for the fall. Throw airline pilots in the mix for holiday travel. Expect wage inflation to continue to pressure CPI readings.
Year-over-year comparisons for nearly every other category will be rising over the next couple of months. Yes, Virginia, the recent good news in inflation is (boom) transitory.
Easy headline?
Note the recent drop in energy costs in the table above. Sagging demand, especially from near-recessionary Europe, has weighed on prices. China’s lackluster recovery has also weighed on prices. Some observers would point to the Biden Administration’s release of oil from the SPR as adding to supplies. There may be some truth to that, watching recent inventory builds.
Saudi Arabia and Russia have responded to weaker demand by cutting production, totaling about 1.5% of daily world demand since last November. The Saudis just announced that they will remove another one million barrels per day for the next two months. There are always a number of reasons why supplies are cut or raised, and state politics play a role. One purely financial reason for this cut may be another stock offering from Saudi Aramco later this year.
From a trading perspective, there are a number of shorts on West Texas Intermediate crude futures. If they start covering, it could force higher prices in the short-term. Demand is high at the moment — the 4th of July was the highest since 2019.
The Strategic Petroleum Reserve has stopped releasing barrels into markets and will become a buyer soon. The Administration has floated ideas about restoring all the released barrels before the next election. That implies a known amount of demand artificially supporting higher oil prices. So, sellers want to cut supplies to get more revenue. Traders are positioned to push prices higher. Now buyers are announcing plans to buy more. Sounds like a recipe for higher energy prices in the coming months. Just when the consumer may need lower prices, as inflation continues to hurt food and housing costs.
That time!
More banks report Tuesday and Wednesday of this week, and we expect the same market reaction. Tuesday, Lockheed, J.B. Hunt and Prologis give us an idea of what the “real” economy is doing. Baker Hughes, Tesla and Halliburton follow on Wednesday along with Netflix. Remote control owners will be curious to hear management’s plans for the firm’s new series in light of the writers’ strike. American Air, Freeport and Whirlpool round out the industrial names this week. The next two weeks are the deluge weeks when we will get a firm handle on whether the -7% drop from last year’s earnings will come to pass.
Wrap-up
The spring stock rally has had longer legs than usual. We enjoy rallies but are mindful of history, high valuations and, dare we say it, some exuberance running around in the stock market.
The Fed is not through raising rates, Europe and China are struggling a bit and the consumer is low on savings. Markets either climb walls of worry, ignore them or cry in front of them. Today it appears they are ignoring them in the face of decent earnings reports. We are mindful one can ignore facts at one’s peril. Our binoculars are ready.
Steve Orr is the Executive Vice President and Chief Investment Officer for Texas Capital Bank Private Wealth Advisors. Steve has earned the right to use the Chartered Financial Analyst and Chartered Market Technician designations. He holds a Bachelor of Arts in Economics from The University of Texas at Austin, a Master of Business Administration in Finance from Texas State University, and a Juris Doctor in Securities from St. Mary’s University School of Law. Follow him on Twitter here.
The contents of this article are subject to the terms and conditions available here.