Building blocks for economic growth.
Back to basics — Week of February 24, 2025

Essential Economics
— Mark Frears
Basics
Getting back to basics, or a minimalist lifestyle, has become fashionable. This not only involves living with less “stuff,” but also fewer financial burdens and expenses. I think the first place we would have to start is with our backyard shed half-filled with Christmas decorations. That’s not going to happen. There is something to this movement; as you have more stuff, you have more obligations to take care of that stuff. Bigger house requires bigger heat/air units, more cleaning and maintenance. Also, there is the potential to focus on what is most important to you and not get caught up in all the baggage. Worth considering.
Elementally
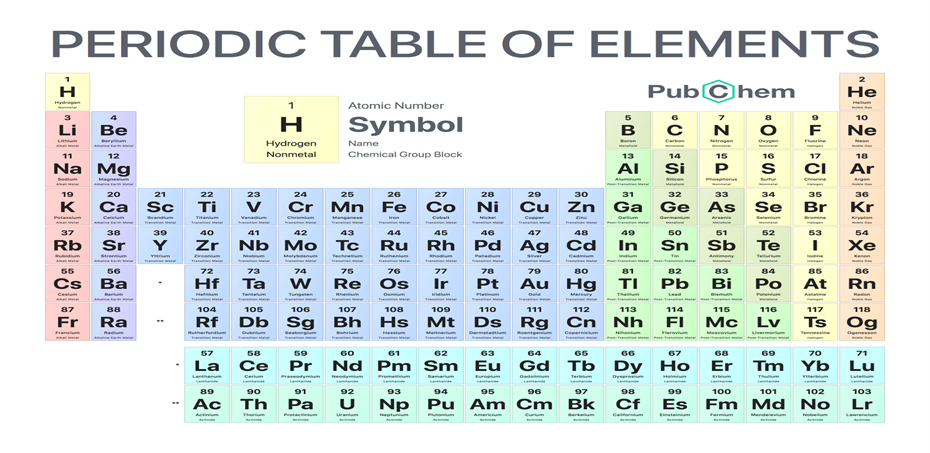
Ancient Greek philosophers pontificated there were only four basic elements: fire, air, water and earth. The chart below shows how modern chemists would portray the basic elements involved in all substances. This gives me serious flashbacks to organic chemistry, but I promise there are not going to be any structure diagrams.
Economically
Given the current uncertainty in the markets, driven by the new administration, it makes sense to go to basics and dig into the building blocks of economic activity. The risk-on mentality in the markets right now is driven by the potential for growth in a lower regulatory environment and how it will manifest itself in building future economic growth. The primary measure of economic activity in the United States is the Gross Domestic Product (GDP), and the history of this metric is shown below.
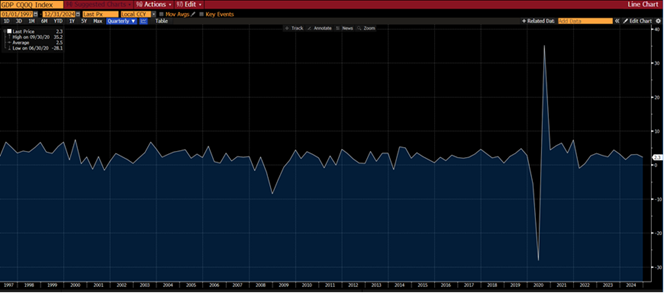
Source: Bloomberg
The components of GDP are personal consumption expenditures, business investment, government expenditures and net exports, as you can see below.
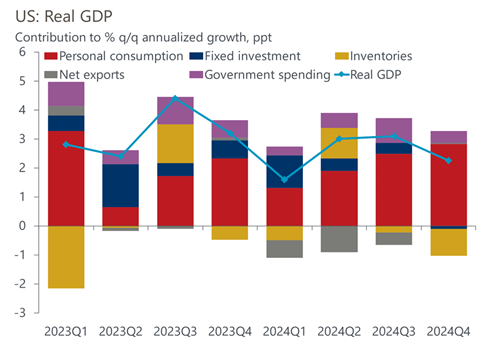
Source: Oxford Economics/Haver Analytics
Digging In
Let’s look at each of these components, or building blocks, for GDP. First, personal consumption expenditures is a very important piece, as it makes up 70% of GDP. This includes purchases of durable goods, non-durable goods and services: everything from cars, food and clothes to banking and healthcare. Second, business investment includes both purchases made to produce, as well as fixed investment. The first part of this covers investment into producing new consumer goods, not just replacing an existing item. The second part, fixed investments, includes business equipment, such as software, capital goods and manufacturing needs. Also, commercial real estate, and residential construction is included here. Third, government spending is a significant part of the total, although the current push is for this to go lower. Fourth, net exports include both goods and services. Therefore, this will only add to GDP if exports are higher than imports for the given period.
Crystal Ball
Now that we know what goes into the measurement of economic activity, how will this be impacted by the current economic and political environment? For the consumer and businesses, spending rolls on, albeit at a steady pace, not a huge upswing. So, this bodes well for growth; the unknown here is how long this will last. Government spending declined in Q4, but after an uptick in Q3. With the Department of Government Efficiency (DOGE) hard at work, this could continue to decline. We must remember that state and local governments contribute here as well, and they are still flush with cash. Lastly, the biggest risk to GDP growth is the impact of tariffs on trade. The threat of tariffs on Canada and Mexico has been kicked down the road, but for China they look to go higher. Based on Oxford Economics projections, as the chart below shows, we could take a material hit to GDP.
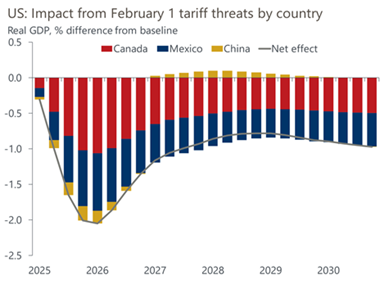
Source: Oxford Economics
Surprisingly the Canada and Mexico tariffs could have a much larger impact as we trade more with them than China. There is much written/speculated about how much tariff income could bring in, but the bigger fear now is the impact on GDP. Stay tuned.
Economic Releases
Last week saw housing slowing with home prices and costs too high, and lower consumer sentiment, due to uncertainty on the tariff front.
This week’s calendar is mostly second-tier information, with consumer confidence, durables, personal income/spending and PCE the highlights. See below for more detail.
Wrap-Up
Going back to basics in economics can help you understand the impact on the bigger picture. Going back to basics in your personal life can help clarify what is important. One of my favorite combinations of elements is Earth, Wind and Fire!
| Upcoming Economic Releases: | Period | Expected | Previous | |
|---|---|---|---|---|
| 24-Feb | Chicago Fed Nat Activity Index | Jan | (0.05) | 0.15 |
| 24-Feb | Dallas Fed Manuf Activity | Feb | 6.4 | 14.1 |
| 24-Feb | Philadelphia Fed Non-Manuf Activity | Feb | N/A | (9.1) |
| 25-Feb | FHHA House Price Index MoM | Dec | N/A | 0.30% |
| 25-Feb | S&P CoreLogic 20-city YoY | Dec | 4.45% | 4.33% |
| 25-Feb | Conf Board Consumer Confidence | Feb | 102.7 | 104.1 |
| 25-Feb | Conf Board Present Situation | Feb | N/A | 134.3 |
| 25-Feb | Conf Board Expectations | Feb | N/A | 83.9 |
| 25-Feb | Richmond Fed Manufacturing Index | Feb | (3) | (4) |
| 25-Feb | Richmond Fed Business Conditions | Feb | N/A | 7 |
| 25-Feb | Dallas Fed Services Activity | Feb | 7.4 | |
| 26-Feb | New Home Sales | Jan | 675,000 | 698,000 |
| 26-Feb | New Home Sales MoM | Jan | -3.3% | 3.6% |
| 27-Feb | GDP Annualized QoQ | Q4 | 2.3% | 2.3% |
| 27-Feb | Personal Consumption | Q4 | 4.1% | 4.2% |
| 27-Feb | GDP Price Index | Q4 | 2.2% | 2.5% |
| 27-Feb | Durable Goods Orders | Jan P | 2.0% | -2.2% |
| 27-Feb | Durable Goods ex Transportation | Jan P | 0.2% | 0.3% |
| 27-Feb | Cap Goods Orders Nondef ex Aircraft | Jan P | 0.3% | 0.4% |
| 27-Feb | Initial Jobless Claims | 22-Feb | 221,000 | 219,000 |
| 27-Feb | Continuing Claims | 15-Feb | 1,872,000 | 1,869,000 |
| 27-Feb | Pending Home Sales MoM | Jan | -0.8% | -5.5% |
| 27-Feb | KC Fed Manufacturing Activity | Feb | N/A | (5) |
| 28-Feb | Personal Income | Jan | 0.4% | 0.4% |
| 28-Feb | Personal Spending | Jan | 0.2% | 0.7% |
| 28-Feb | Real Personal Spending | Jan | -0.1% | 0.4% |
| 28-Feb | Retail Inventories MoM | Jan | 0.2% | -0.3% |
| 28-Feb | Wholesale Inventories MoM | Jan P | 0.1% | -0.5% |
| 28-Feb | PCE Deflator YoY | Jan | 2.5% | 2.6% |
| 28-Feb | PCE Core Deflator YoY | Jan | 2.% | 2.8% |
| 28-Feb | KC Fed Services Activity | Feb | N/A | (4) |
Mark Frears is a Senior Investment Advisor, Managing Director, at Texas Capital Private Bank. He holds a Bachelor of Science from The University of Washington, and an MBA from University of Texas – Dallas.
The contents of this article are subject to the terms and conditions available here.
Texas Capital Private Bank™ refers to the wealth management services offered by the bank and non-bank entities comprising the Texas Capital brand, including Texas Capital Bank Private Wealth Advisors (PWA). Nothing herein is intended to constitute an offer to sell or buy, or a solicitation of an offer to sell or buy securities.
Investing is subject to a high degree of investment risk, including the possible loss of the entire amount of an investment. You should carefully read and review all information provided by PWA, including PWA’s Form ADV, Part 2A brochure and all supplements thereto, before making an investment.
Neither PWA, the Bank nor any of their respective employees provides tax or legal advice. Nothing contained on this website (including any attachments) is intended as tax or legal advice for any recipient, nor should it be relied on as such. Taxpayers should seek advice based on the taxpayer’s particular circumstances from an independent tax advisor or legal counsel. The wealth strategy team at PWA can work with your attorney to facilitate the desired structure of your estate plan. The information contained on this website is not a complete summary or statement of all available data necessary for making an investment decision, and does not constitute a recommendation. The information has been obtained from sources considered to be reliable, but we do not guarantee that the foregoing material is accurate or complete. Any opinions are those of the authors and not necessarily those of PWA or the Bank.
©2026 Texas Capital Bank Wealth Management Services, Inc., a wholly owned subsidiary of Texas Capital Bank. All rights reserved.
Texas Capital Bank Private Wealth Advisors and the Texas Capital Bank Private Wealth Advisors logo are trademarks of Texas Capital Bancshares, Inc., and Texas Capital Bank.
www.texascapitalbank.com NASDAQ®: TCBI