Thinking leads to behavior — Week of December 16, 2024

Essential Economics
— Mark Frears
Perception
If you feel good, will that change your behavior? If you had a new haircut (for those who have to) and new clothes, and had just received a great review at work, will that change what you do? You didn’t actually receive any compensation for any of those, and actually it cost you something. So, will you go out and spend because of your mindset? Back in the day when people carried cash, if there was more in my pocket, I might be more inclined to do some shopping.
Your mindset and perception will have a material impact on your actions. Let’s dig deeper into the wealth effect and how that plays out in economic growth.
Net worth
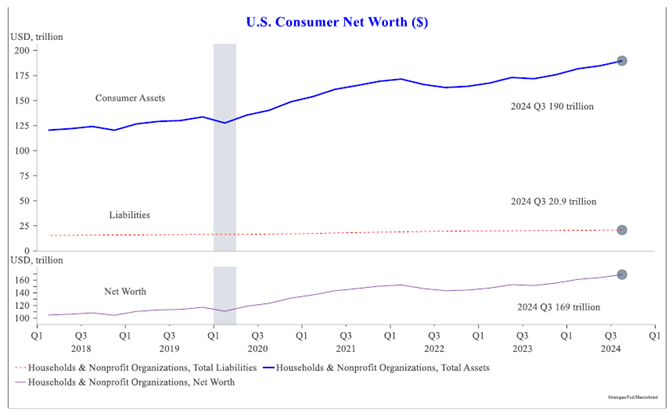
Your financial significance is simply the value of all your assets, less the value of your liabilities. This is your net worth. As you can see below, the consumer’s net worth has been on a nice upward trajectory.

Source: Strategas Research
Liabilities, or loans, have been basically flat, while assets such as stocks and houses have been appreciating. For example, your mortgage is locked in, and you are paying it down gradually, but your house’s value is going up in most areas of the country. You have not received any additional money, unless you sell the house, but your net worth is going up, and most people’s mindset improves as they have more valuable assets.
Spending
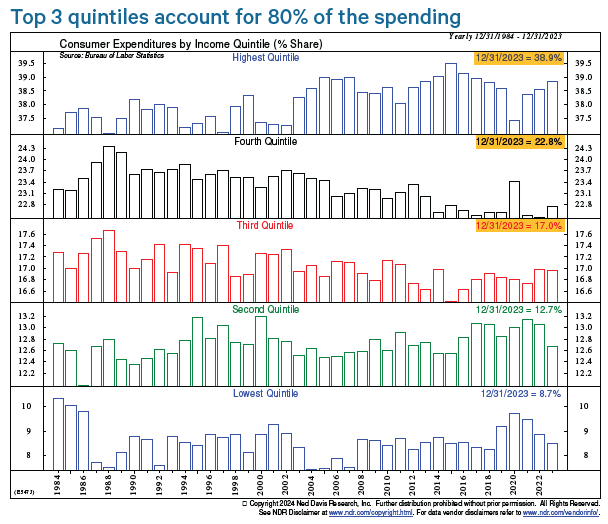
One of the quandaries that economists have been wrestling with is how the Gross Domestic Product (GDP) continues to grow faster than expected, given the normal inputs of corporate and consumer impacts. What we can see is that the top three household sectors account for 80% of the spending. As you can see below, this is where wealth is concentrated.

Source: Ned Davis Research
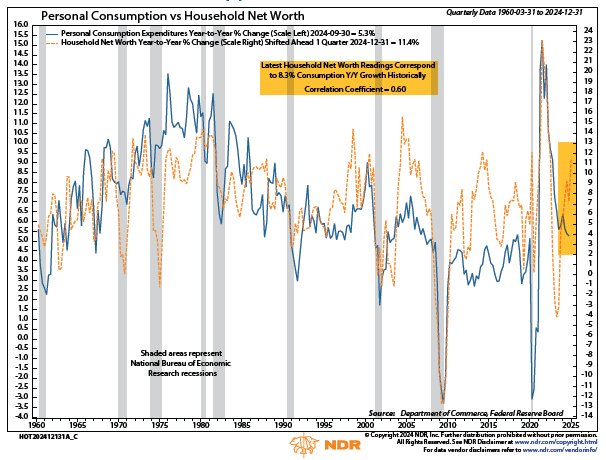
This starts to make sense, as to how the economy is humming along, better than expected. In fact, as shown below for every 1% increase in household net worth, there is a 0.4% year-over-year increase in consumption one quarter later.

Source: Ned Davis Research
Other trends
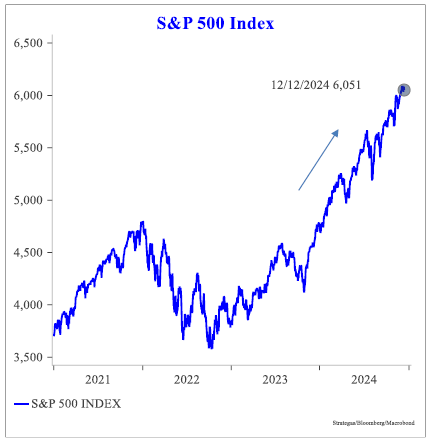
As people continue to spend, the value of the companies who are producing the goods and services continues to rise. As you can see below, the S&P 500 Index is on a very nice upward trend.

Source: Strategas Research
The underlying consumer spending has maintained a steady upward trend, as seen below.

Source: Strategas Research
Digging deeper
While this appears to be a great trend, nothing can go on forever. What could get in the way of continued growth and/or spending?
First of all, it must be kept in mind that this is, for the most part, net worth increases based on unrealized gains. That is your stock is going up and your house is gaining value, but until you sell them, you don’t actually have the cash. This is a mindset, or perception, not yet money in the bank.
Second, what would happen if the stock market had a material pullback or selloff? This might be for an outside, perhaps global, reason that really wasn’t driven by earnings. In this case, you no longer feel so great, and actually might think about putting off some of those discretionary purchases, or not taking that vacation. As GDP is 2/3 driven by consumer spending, this could have a big impact.
Third, in order to sustain this upward trend in GDP, we need to have the housing and manufacturing sectors start to take a bigger role. Housing needs more supply, and lower short-term rates would make borrowing cheaper for these builders. In addition, if long-term rates came down, mortgages would be more affordable. While we may see a few more Fed cuts on the short end, longer-term rates are more driven by economic growth and inflation expectations. Those don’t look to be coming down in the near term. Lower short-term rates would make borrowing cheaper for small businesses who usually borrow at the prime rate, and if they were to become a bigger part of the economy, we would see sustained growth.
Economic releases
Last week, we saw some slightly higher-than-expected inflation prints, but not enough to derail the FOMC on their cut for next week. Current futures markets show a 96% chance of a rate cut.
This week’s calendar is all about the FOMC meeting on December 17-18. Not only will we most likely see a 25 basis point (bp) Fed rate cut, but we also get the new Summary of Economic Projections and new Dot Plot. See below for other releases.
Wrap-Up
How we think drives so much of our behavior. We certainly need to be aware of that, especially if we are spending money we really don’t have!
| Upcoming Economic Releases: | Period | Expected | Previous | |
|---|---|---|---|---|
| 16-Dec | Empire Manufacturing | Dec | 10.0 | 31.2 |
| 16-Dec | S&P Global US Manufacturing PMI | Dec P | 49.5 | 49.7 |
| 16-Dec | S&P Global US Services PMI | Dec P | 55.8 | 56.1 |
| 16-Dec | S&P Global US Composite PMI | Dec P | 55.1 | 54.9 |
| 17-Dec | Retail Sales MoM | Nov | 0.5% | 0.4% |
| 17-Dec | Retail Sales ex Autos MoM | Nov | 0.4% | 0.1% |
| 17-Dec | NY Fed Services Business Activity | Dec | N/A | (0.5) |
| 17-Dec | Industrial Production MoM | Nov | 0.3% | -0.3% |
| 17-Dec | Capacity Utilization | Nov | 77.3% | 77.1% |
| 17-Dec | Business Inventories | Oct | 0.1% | 0.1% |
| 17-Dec | NAHB Housing Market Index | Dec | 47 | 46 |
| 18-Dec | Building Permits | Nov | 1,430,000 | 1,416,000 |
| 18-Dec | Building Permits MoM | Nov | 1.0% | -0.6% |
| 18-Dec | Housing Starts | Nov | 1,343,000 | 1,311,000 |
| 18-Dec | Housing Starts MoM | Nov | 2.4% | -3.1% |
| 18-Dec | FOMC Rate Decision (Upper Bound) | 1p CT | 4.50% | 4.75% |
| 18-Dec | FOMC Rate Decision (Lower Bound) | 1p CT | 4.25% | 4.50% |
| 19-Dec | GDP Annualized QoQ | Q3 | 2.8% | 2.8% |
| 19-Dec | Personal Consumption | Q3 | 3.7% | 3.5% |
| 19-Dec | GDP Price Index | Q3 | 1.9% | 1.9% |
| 19-Dec | Philadelphia Fed Business Outlook | Dec | 2.9 | (5.5) |
| 19-Dec | Initial Jobless Claims | 14-Dec | 229,000 | 242,000 |
| 19-Dec | Continuing Claims | 7-Dec | N/A | 1,886,000 |
| 19-Dec | Leading Index | Nov | -0.1% | -0.4% |
| 19-Dec | Existing Home Sales MoM | Nov | 3.0% | 3.4% |
| 19-Dec | Existing Home Sales | Nov | 4,080,000 | 3,960,000 |
| 19-Dec | KC Fed Manufacturing Activity | Dec | N/A | (2) |
| 20-Dec | Personal Income | Nov | 0.4% | 0.6% |
| 20-Dec | Personal Spending | Nov | 0.5% | 0.4% |
| 20-Dec | Real Personal Spending | Nov | 0.3% | 0.1% |
| 20-Dec | PCE Deflator YoY | Nov | 2.5% | 2.3% |
| 20-Dec | PCE Core Deflator YoY | Nov | 2.9% | 2.8% |
| 20-Dec | Consumer Sentiment | Dec F | 74.0 | 74.0 |
| 20-Dec | Current Conditions | Dec F | N/A | 77.7 |
| 20-Dec | Expectations | Dec F | N/A | 71.6 |
| 20-Dec | 1-yr inflation | Dec F | N/A | 2.9% |
| 20-Dec | 5-10-yr inflation | Dec F | N/A | 3.1% |
| 20-Dec | KC Fed Services Activity | Dec | N/A | 9 |
Mark Frears is a Senior Investment Advisor, Managing Director, at Texas Capital Bank Private Wealth Advisors. He holds a Bachelor of Science from The University of Washington, and an MBA from University of Texas – Dallas.
The contents of this article are subject to the terms and conditions available here.
Texas Capital Private Bank™ refers to the wealth management services offered by the bank and non-bank entities comprising the Texas Capital brand, including Texas Capital Bank Private Wealth Advisors (PWA). Nothing herein is intended to constitute an offer to sell or buy, or a solicitation of an offer to sell or buy securities.
Investing is subject to a high degree of investment risk, including the possible loss of the entire amount of an investment. You should carefully read and review all information provided by PWA, including PWA’s Form ADV, Part 2A brochure and all supplements thereto, before making an investment.
Neither PWA, the Bank nor any of their respective employees provides tax or legal advice. Nothing contained on this website (including any attachments) is intended as tax or legal advice for any recipient, nor should it be relied on as such. Taxpayers should seek advice based on the taxpayer’s particular circumstances from an independent tax advisor or legal counsel. The wealth strategy team at PWA can work with your attorney to facilitate the desired structure of your estate plan. The information contained on this website is not a complete summary or statement of all available data necessary for making an investment decision, and does not constitute a recommendation. The information has been obtained from sources considered to be reliable, but we do not guarantee that the foregoing material is accurate or complete. Any opinions are those of the authors and not necessarily those of PWA or the Bank.
©2026 Texas Capital Bank Wealth Management Services, Inc., a wholly owned subsidiary of Texas Capital Bank. All rights reserved.
Texas Capital Bank Private Wealth Advisors and the Texas Capital Bank Private Wealth Advisors logo are trademarks of Texas Capital Bancshares, Inc., and Texas Capital Bank.
www.texascapitalbank.com NASDAQ®: TCBI