Springtime hail — Week of April 24, 2023

Essential Economics
— Mark Frears
Hail or not
As we live in Texas in the spring, we have these small (sometimes) ice pellets falling from the sky. It’s one incentive to have your garage cleaned out so you can get the car under cover. Most people like a smooth surface to their hoods and roofs. One of the problems is that there is not much notice of when this will occur, and it is usually very localized. What are the indicators telling us about the economy?
The general feel to the market is that the economy is slowing down. Is that really going to happen, and what will the implications be? We will look at this from the consumer, business and other indicators’ perspectives.
Consumer
As you and I drive two-thirds of Gross Domestic Product (GDP), we need to take a close look at our behaviors. The first thing that drives us is whether we have a job and how much we are paid. The Jobless Claims release is a weekly indicator that gives us a sense of how many people are losing their jobs. As you can see below, we are coming off the post-pandemic lows, starting to see more people struggling to find work.
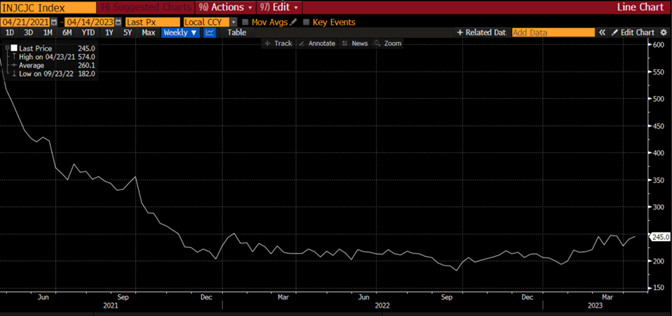
Source: Bloomberg
If we have jobs and are confident in our ability to hold them or get another one, if necessary, then we will usually spend away. As you can see below, Retail Sales has taken a dip in the most recent time periods.

There are a couple of other nuances to the consumer spending picture. First, with inflation causing goods and services to cost more, while you may spend the same dollar amount, you are not getting as much as you used to. Second, where are the funds coming from to support this spending? The chart below shows that consumers are having to borrow more to fuel their spending habit. Credit card debt has risen to record levels, up 16% since the start of 2022, according to the Federal Reserve.

So, it appears that the consumer’s ability to fuel economic growth has the potential to slow down.
Business
Companies have had a hard time of it over the last couple years. Pandemic initially brought decreased demand for many, followed up with the inability to access materials and/or people to run the business. On top of that, costs were high for their inputs, although they were able to pass along some of those, depending on demand, in higher prices to their customers.
A good place to look for insights as to future business is how many new orders are being placed. The chart below shows the Institute of Supply Management (ISM) Manufacturing Report’s New Orders. The trend since third quarter 2021 is not good. In addition, we have been below the contraction/expansion line of 50 since September of last year.

Source: Bloomberg
If a business has found the right model to keep the doors open and has a positive cash flow, things have been going okay. The next question on their minds is if they need to borrow to acquire inventory or expand their business, will the rate be favorable and when will it be available?
The chart below shows the net share of business owners reporting that conditions tightened from three months earlier.

The Fed has been trying to slow the economy down, in order to force inflation lower, and have had pretty good success, up to a point. Their efforts seem to have stalled and they are still some distance from the two percent target.
Commentators are pointing out that the bank failures in early March may have caused regional and community banks to pay more attention to liquidity, capital and credit, and consequently slow lending. These banks supply much of the funding for the essential small and medium sized businesses. The Fed would not be opposed to this, if it helps them reach their inflation goals sooner. It is a slippery slope, trying to hit that soft landing.
Indicators
There are so many areas of the markets that we can look to for insights as to the future, some more reliable than others. Last week we had the Conference Board’s U.S. Leading Index’s latest release, showing us the twelfth consecutive monthly decline. That doesn’t sound too promising. The components that contributed the most to March decline were Leading Credit Index, Average Consumer Expectations for Business Conditions, and ISM New Orders Index.
As you can see in the chart below, this index is signaling a recession to come at some point over the next 12 months.

The markets also pay close attention to the Fed and what they are going to do with short-term rates. The Fed governors, bank presidents and other assorted dignitaries have been out in force over the last couple of weeks. Soon they will be entering the nonspeaking time, leading up to the May 2 – 3 Federal Open Market Committee. Most of them are saying they are not done raising rates because inflation is not back to their target yet.
The Fed Funds (FF) futures markets shows they will move up another 25 basis points (0.25%) in May and may take a short pause before they start cutting rates later this year. I believe they should try to send the message to the markets that they will be vigilant in fighting inflation, yet still take a pause in raising rates again. They started raising rates too late to stop inflation in its tracks, and then took rates up at an unprecedented pace. There is a lag effect when you change rates, and it would do them good to pause and evaluate. In addition, hiking rates again would increase variable rate borrowing costs for businesses at a time when they can least afford it.
Economic releases
This week we will have a downpour (hopefully not hail) of releases. Multiple cities will report their manufacturing and services situations. Consumer Confidence, which reflects job situations, will be interesting to watch. Also on tap, we have Durable goods, GDP for first quarter, Personal Spending and Income, Personal Consumption Expenditures (Fed’s inflation gauge), and UofM Consumer Sentiment. See below for more information.
Wrap-up
Economic forecasters may not be much better than weather forecasters, but there is some merit in the indicators we have looked at here. Slowing is coming. When will it hit us like Texas summer heat?!
| Upcoming Economic Releases: | Period | Expected | Previous | |
|---|---|---|---|---|
| 24-Apr | Chicago Fed Nat'l Activity Index | Mar | (0.20) | (0.19) |
| 24-Apr | Dallas Fed Manuf Activity | Apr | (11.0) | (15.7) |
| 25-Apr | Philadelphia Fed Non-Manuf Activity | Apr | N/A | (12.8) |
| 25-Apr | FHFA House Price Index MoM | Feb | -0.2% | 0.2% |
| 25-Apr | S&P CoreLogic Home Price 20-City YoY | Feb | -0.10% | 2.55% |
| 25-Apr | New Home Sales | Mar | 630,000 | 640,000 |
| 25-Apr | New Home Sales MoM | Mar | -1.6% | 1.1% |
| 25-Apr | Conf Board Consumer Confidence | Apr | 104.0 | 104.2 |
| 25-Apr | Conf Board Present Situation | Apr | N/A | 151.1 |
| 25-Apr | Conf Board Expectations | Apr | N/A | 73.0 |
| 25-Apr | Richmond Fed Manuf Index | Apr | (8) | (5) |
| 25-Apr | Richmond Fed Business Conditions | Apr | N/A | (17) |
| 25-Apr | Dallas Fed Services Activity | Apr | N/A | (18.0) |
| 26-Apr | Wholesale Inventories MoM | Mar | 0.1% | 0.1% |
| 26-Apr | Durable Goods Orders | Mar | 0.8% | -1.0% |
| 26-Apr | Durable Goods ex Transportation | Mar | -0.2% | -0.1% |
| 26-Apr | Cap Goods Orders Nondef ex Aircraft | Mar | 0.1% | -0.1% |
| 27-Apr | Initial Jobless Claims | 22-Apr | 250,000 | 245,000 |
| 27-Apr | Continuing Claims | 15-Apr | 1,884,000 | 1,865,000 |
| 27-Apr | GDP Annualized QoQ | Q1 | 2.0% | 2.6% |
| 27-Apr | Personal Consumption | Q1 | 4.0% | 1.0% |
| 27-Apr | GDP Price Index | Q1 | 3.7% | 3.9% |
| 27-Apr | Pending Home Sales MoM | Mar | 1.0% | 0.8% |
| 27-Apr | KC Fed Manufacturing Activity | Apr | (2) | 0 |
| 28-Apr | Employment Cost Index | Q1 | 1.1% | 0.2% |
| 28-Apr | Personal Income | Mar | 0.2% | 0.3% |
| 28-Apr | Personal Spending | Mar | -0.1% | 0.2% |
| 28-Apr | Real Personal Spending | Mar | -0.1% | -0.1% |
| 28-Apr | PCE Deflator YoY | Mar | 4.1% | 5.0% |
| 28-Apr | PCE Core Deflator YoY | Mar | 4.5% | 4.6% |
| 28-Apr | MNI Chicago PMI | Apr | 43.5 | 43.8 |
| 28-Apr | UM (Go MSU) Consumer Sentiment | Apr | 63.5 | 63.5 |
| 28-Apr | UM (Go MSU) Current Expectations | Apr | N/A | 68.6 |
| 28-Apr | UM (Go MSU) Expectations | Apr | N/A | 60.3 |
| 28-Apr | UM (Go MSU) 1-yr inflation | Apr | N/A | 4.6% |
| 28-Apr | UM (Go MSU) 5- to 10-yr inflation | Apr | N/A | 2.9% |
| 28-Apr | KC Fed Services Activity | Apr | N/A | (4) |
Mark Frears is an Investment Advisor, Executive Vice President, at Texas Capital Bank Private Wealth Advisors. He holds a Bachelor of Science from The University of Washington, and an MBA from University of Texas – Dallas.
The contents of this article are subject to the terms and conditions available here.