Who do you owe? — Week of August 14, 2023

Essential Economics
— Mark Frears
Indebtedness
The first debt I took on was when my father sold me his car. He made it doable, in that I had twelve months to pay it off, in equal payments. Surprisingly, for my dad, he did not charge me interest! Probably wasn’t reported to the credit bureaus though, so it did not help my credit rating.
Debt can be a blessing or a curse, depending on many factors, including the value of the underlying asset, cost of borrowing and the ability to repay. Let’s look at how this plays out in the consumer, commercial and government sectors.
Consumers
As you and I are the main drivers of economic growth, it matters whether we are spending, and on what. For us to spend, it must come from one of three sources: income, savings or borrowings. Home and car purchases are usually the largest debt incurred, but credit cards and student loans are growing rapidly.
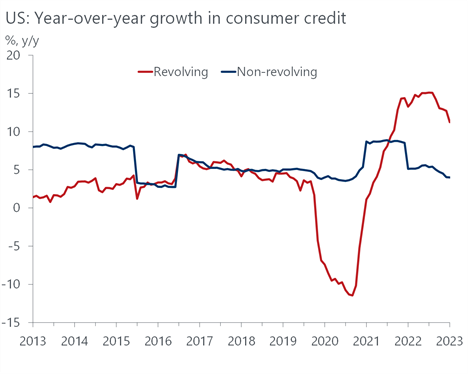
We break consumer debt into revolving (open-ended, such as credit cards) and non-revolving (used for a single purpose, as in house, car, student loan). In general, revolving is more flexible and comes with a higher interest rate. As you can see below, revolving growth has been higher, but is slowing faster than non-revolving. This is due to the high cost of credit card debt, and perhaps tighter lending standards.
Source: Oxford Economics/Haver Analytics
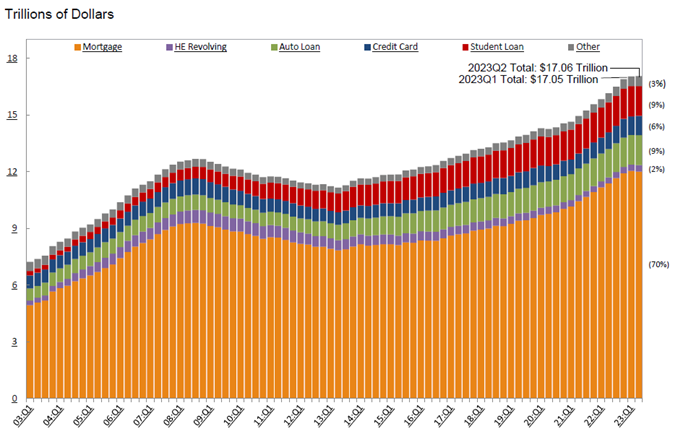
The amount of outstanding consumer debt topped seventeen trillion dollars in the second quarter, with over one trillion in credit cards. Wow. As you can see below, mortgages make up 70% of all debt, but have plateaued in the last couple of quarters, with other categories picking up the growth.
Source: New York Fed Consumer Credit Panel/Equifax
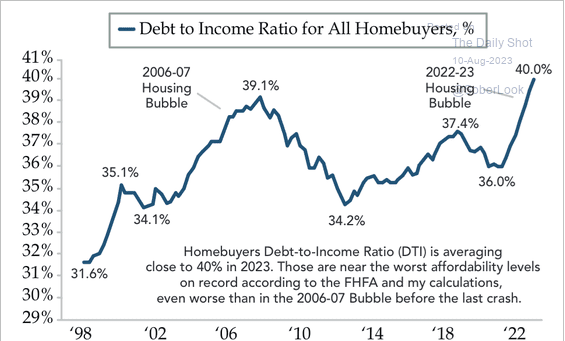
So, we can see that a lot of people are borrowing. The good news on mortgages is that most were locked in, taking advantage of the low interests prior to the last year. The consumer’s balance sheet is also in good shape coming out of the pandemic; people were able to save and pay down some debt. We have not yet seen cracks forming in delinquencies or delayed payments on these loans, but that is being watched carefully. In addition, student loans have been on hiatus from payments but those are about to ramp back up. Reflecting continued higher costs of housing, the chart below shows that the homebuyer is above historic levels of debt in relation to income.
Source: FHFA
You borrow, and banks lend, based on your ability to repay the debt. As we are still experiencing a strong labor market, people feel confident in their employment, or their ability to get another job if necessary. This confidence will continue to fuel borrowing, but it would be prudent to consider the value of what you are going in debt for versus the cost.
Commercial
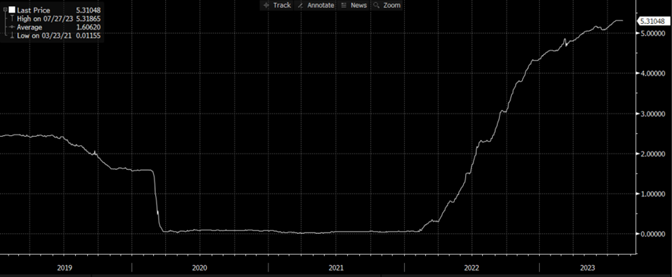
Companies also did a good job of cleaning up their balance sheets during the pandemic, but the cost of borrowing, as well as the cost of labor, has driven costs higher. Most companies borrow on a floating rate basis, usually short-term. The one-month Secured Overnight Financing Rate (SOFR) is used as a benchmark with loans priced with a spread above this, based on the creditworthiness of the borrower. As you can see below, if their credit spread stayed stable, their costs went up over 5.00% since early 2022.
Source: Bloomberg
As the Fed continues to increase short-term rates, companies and borrowers at the Prime Rate (currently 8.50%) are the ones bearing the brunt of the impact. If they push the rate higher still, the recession may be supply driven and then flow through to the demand side.
Government
We have been hearing more about government debt lately, after the amount of spending continues to outpace revenues. Just like the consumer, if their expenses are larger than their income, they must take from savings, or borrow. As there are no savings left, it’s off to the debt issuance market. Recently we heard a noise coming from D.C. like a can being kicked down the road. That was the debt ceiling being raised again, so that they can continue to operate.
There are a few areas of concern here. One, how will the government be able to repay this debt? Sounds like a crazy question, but as you can see below, the current debt is approximately 120% of Gross Domestic Product (GDP). Without substantial reduction in spending, it will be hard to make a dent in this obligation.
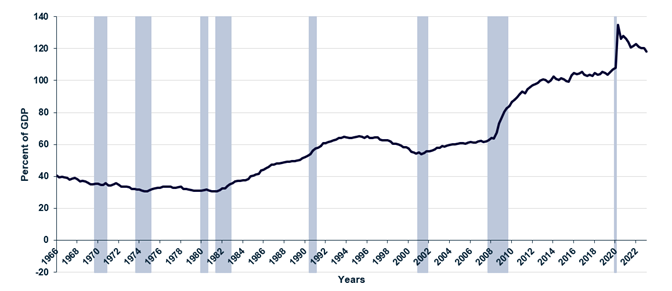
Source: Federal Reserve Economic Data (FRED) – St. Louis Fed
Two, as the amount of debt continue to grow, will they continue to finder buyers? Currently there is over $30 trillion in Bills, Notes and Bonds outstanding. As you can see below, The U.S. depends on the public to buy almost $25 trillion.
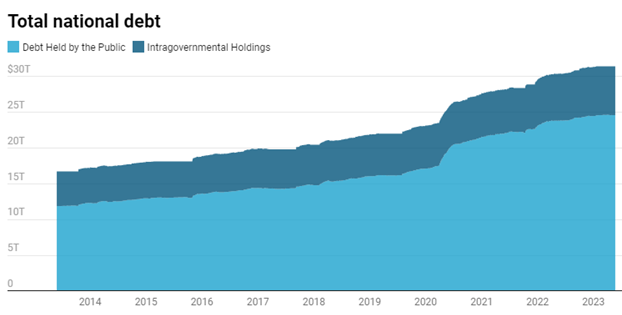
Source: U.S. Treasury (Chart: Janet Nguyen/Marketplace)
These are purchased by banks, insurance companies, state and local governments, foreign governments, and private investors. You often hear how we are dependent on other countries to keep buying this debt, and as you can see below, Japan and China are the top two in this category.
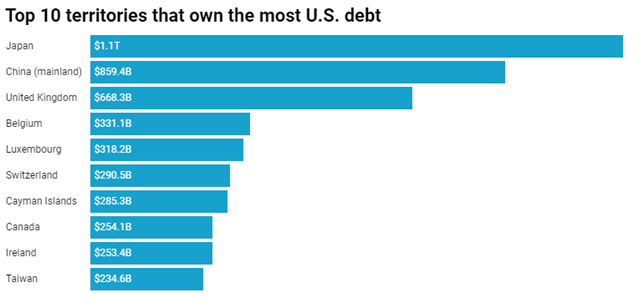
Source: U.S. Treasury Chart: Janet Nguyen/Marketplace)
Three, what is the cost of servicing this debt? As the Fed has pushed rates higher due to inflation pressures, this has also increased rates that must be paid on this borrowing. The chart below shows the current annual bill. Staggering.
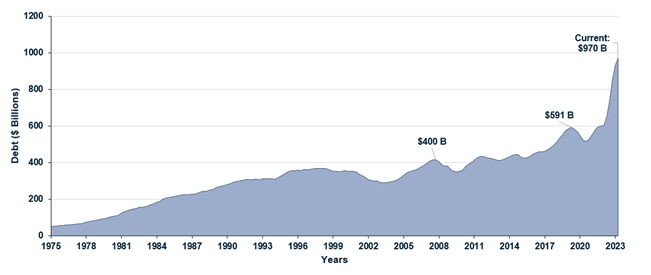
Source: Federal Reserve Economic Data (FRED) — St. Louis Fed and Bloomberg
This is a huge concern for our nation going forward. You and I cannot rely on credit cards to sustain our lifestyle on a long-term basis. That is essentially what the U.S. government is trying to do.
Economic releases
Inflation numbers came in about as expected last week. The markets took them as more ammunition for the Fed to pause in September, but November is still on the table.
This week is housing, FOMC minutes from July meeting, and the Leading Index. See below for details.
Wrap-Up
The car I bought was a 1970 Oldsmobile Cutlass convertible; the perfect car to take to college. Its value was in line with what I paid for it, and I did not miss a payment. As debt increases in the economy, it makes good sense to watch for missed payments or other signs of stress.
| Upcoming Economic Releases: | Period | Expected | Previous | |
|---|---|---|---|---|
| 15-Aug | Retail Sales MoM | Jul | 0.4% | 0.2% |
| 15-Aug | Retail Sales ex Autos MoM | Jul | 0.4% | 0.2% |
| 15-Aug | Import Price Index MoM | Jul | 0.2% | -0.2% |
| 15-Aug | Export Price Index MoM | Jul | 0.2% | -0.9% |
| 15-Aug | Empire Manufacturing | Aug | (0.7) | 1.1 |
| 15-Aug | Business Inventories | Jun | 0.1% | 0.2% |
| 15-Aug | NAHB Housing Market Index | Aug | 56 | 56 |
| 16-Aug | Building Permits | Jul | 1,468,000 | 1,440,000 |
| 16-Aug | Building Permits MoM | Jul | 1.9% | -3.7% |
| 16-Aug | Housing Starts | Jul | 1,445,000 | 1,434,000 |
| 16-Aug | Housing Starts MoM | Jul | 0.8% | -8.0% |
| 16-Aug | NY Fed Services Business Activity | Aug | N/A | 0.0 |
| 16-Aug | Industrial Production MoM | Jul | 0.3% | -0.5% |
| 16-Aug | Capacity Utilization | Jul | 79.1% | 78.9% |
| 16-Aug | FOMC Minutes released from July 26 Meeting at 1p CT | |||
| 17-Aug | Initial Jobless Claims | 12-Aug | 240,000 | 248,000 |
| 17-Aug | Continuing Claims | 5-Aug | 1,700,000 | 1,684,000 |
| 17-Aug | Philadelphia Fed Business Outlook | Aug | (10.5) | (13.5) |
| 17-Aug | Leading Index | Jul | -0.4% | -0.7% |
Mark Frears is an Investment Advisor, Executive Vice President, at Texas Capital Bank Private Wealth Advisors. He holds a Bachelor of Science from The University of Washington, and an MBA from University of Texas – Dallas.
The contents of this article are subject to the terms and conditions available here.