Up and down — Week of July 22, 2024

Essential Economics
— Mark Frears
Mountains
Have you caught any of the Tour de France this year? These guys are amazing athletes, riding for days over many, many miles. Sprinting at times, riding over cobblestones and through beautiful scenery. I think the differentiator for the top riders is how they handle the steepness of the Alps and the Pyrenees. Tadej Pogačar gets up on his pedals and accelerates going up 10% gradients! It is also amazing how they handle the downhills, flying along at over 50 mph on curving roads.
Financial markets focus on steepness of curves also, but without the beautiful scenery.
Zero risk
The U.S. Treasury (UST) market is considered to be the benchmark for risk-free rates, and all other term rates are based on a spread over UST. This fact, along with the huge size ($34 trillion and growing) of the UST market, (see below), makes it the one to watch.
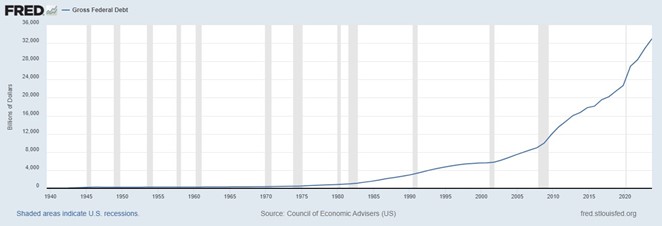
Source: Bianco Research
Steepness
Related to the UST market, you will hear terms like inverted curve, especially lately. The chart below shows current rates (top curve) and rates from December 2017 (bottom curve).
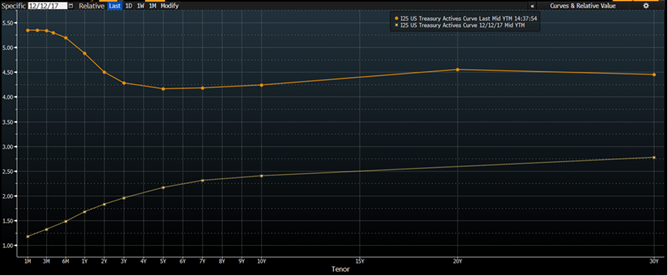
Source: Bloomberg
These are called yield curves, as they show rates with maturities from one month out to 30 years, and every point in between. The December 2017 curve is called a normal, or positively sloping curve as rates increase as you go further out in maturity. The current curve is inverted, as longer-term rates are lower than short-term rates.
A positive sloping curve would indicate a growing, strong economy, as longer-term rates reflect more inflation. A negative sloping, inverted curve indicates a coming recession, with slower economic growth bringing lower long-term rates. These curves have been looked at as leading indicators, and the current inverted curve has been in place much longer than normal. This is one reason the markets were expecting a recession to rear its ugly head, but that keeps getting pushed out.
One nuance of watching steepness of the yield curve is what portion of the curve do you look at. To some degree, different factors drive rates for the overnight rate and the 10-year UST. In general, the overnight and one-month rates are driven by the Fed and the expectations for what they will do next. The longer part of the curve should be more driven by future growth/inflation expectations. That is, what will the economy look like 10 years in the future.
In addition, you can’t look at the rates in isolation, as you must factor in supply and demand. In the past few years, the U.S. has been the highest-performing economy in the world, and consequently attracts investors. As global investors purchase UST, this demand drives up price, and therefore yields are lower. On the supply side, if the U.S. continues to issue ever growing debt, at some point the demand will not be able to keep up, and yields will have to go higher.
As you can see, this is a complex environment and makes it hard to draw straightforward conclusions, as the long-expected recession bears out. The most common curve to watch is the 2- to 10-year section. Last week this was negative 23 basis points (bp), or 0.23%. You obtain this by subtracting the 2-year yield from the 10-year yield (4.23% to 4.46%). This spread has been negative, inverted, since mid-2022.
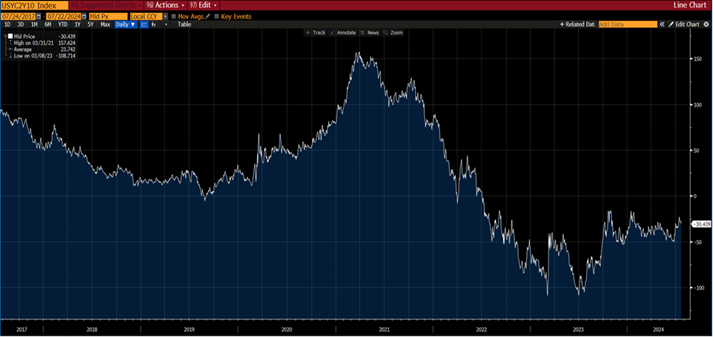
Source: Bloomberg
Another curve that is closely watched is the 3-month to 10-year section. This one is more influenced by Fed moves, as the 3-month T-Bill will follow very closely with Fed cuts/hikes and expectations. This curve, also inverted, since Q4 2022 has a very high correlation for predicting recessions. So far this has not materialized.
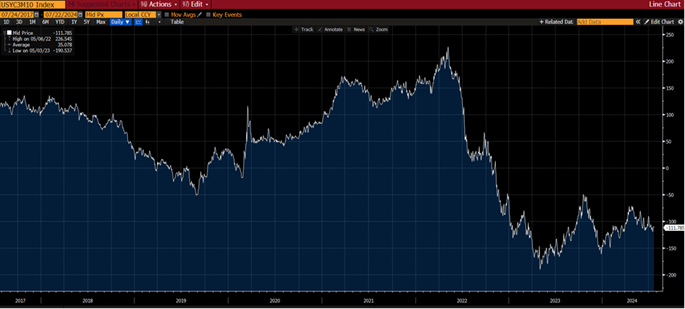
Source: Bloomberg
Traders
As these curves are closely watched, there will be speculation on the future direction. One strategy is a “bull steepener,” when prices are rising (therefore bull market) and they are rising faster in the short end of the curve. This means rates are falling faster in the short end, and the curve is steepening.
Another strategy is the “bear flattener.” In this case prices are falling (bear market), faster in the short end of the curve, causing rates to rise more in this area, and the curve to flatten, or become less positive. It also depends on the section of the curve you are watching, as these relative moves may be isolated in one area.
Are we in a new normal, where inverted curves don’t predict recessions? Possibly it is the other factors we cited above, and/or, it is still coming. Another part of the financial markets for you to dig deeper on.
Economic releases
Last week was Retail Sales, Housing and Leading Index. Fed talking heads seem to be pointing toward an ease later this year. Jury is still out, as short-term UST have not built this in.
This week’s calendar is more housing, first guess at Q2 GDP, Durables, Personal income and spending, and ending with consumer sentiment. Fed speakers are on blackout ahead of the July 30-31 FOMC meeting. Political wrangling will dominate most of the airwaves. See below for details.
Wrap-Up
Steepness and flatness are relative and depends on many factors. We face many mountains and valleys in our walk. There are advantages and disadvantages to both. How are you handling them?
| Upcoming Economic Releases: | Period | Expected | Previous | |
|---|---|---|---|---|
| 22-Jul | Chicago Fed Nat Activity Index | Jun | (0.09) | 0.18 |
| 23-Jul | Phila Fed Non-manuf Activity | Jul | N/A | 2.9 |
| 23-Jul | Richmond Fed Manufacturing Index | Jul | (7) | (10) |
| 23-Jul | Richmond Fed Business Conditions | Jul | N/A | (11) |
| 23-Jul | Existing Home Sales | Jun | 3,990,000 | 4,110,000 |
| 23-Jul | Existing Home Sales MoM | Jun | -3.0% | -0.7% |
| 24-Jul | Wholesale Inventories MoM | Jun P | N/A | 0.6% |
| 24-Jul | Retail Inventories MoM | Jun | N/A | 0.7% |
| 24-Jul | S&P Global US Manufacturing PMI | Jul P | 51.7 | 51.6 |
| 24-Jul | S&P Global US Services PMI | Jul P | 54.8 | 55.3 |
| 24-Jul | S&P Global US Composite PMI | Jul P | N/A | 54.8 |
| 24-Jul | New Home Sales | Jun | 640,000 | 619,000 |
| 24-Jul | New Home Sales MoM | Jun | 3.4% | -11.3% |
| 25-Jul | GDP Annualized QoQ | Q2 | 1.9% | 1.4% |
| 25-Jul | Personal Consumption | Q2 | 1.8% | 1.5% |
| 25-Jul | GDP Price Index | Q2 | 2.6% | 3.1% |
| 25-Jul | Initial Jobless Claims | 20-Jul | 238,000 | 243,000 |
| 25-Jul | Continuing Claims | 13-Jul | 1,861,000 | 1,867,000 |
| 25-Jul | Durable Goods Orders | Jun P | 0.5% | 0.1% |
| 25-Jul | Durable Goods ex Transportation | Jun P | 0.2% | -0.1% |
| 25-Jul | Cap Goods Orders Nondef ex Aircraft | Jun P | 0.2% | -0.6% |
| 25-Jul | KC Fed Manufacturing Activity | Jul | (5) | (8) |
| 26-Jul | Personal Income | Jun | 0.4% | 0.5% |
| 26-Jul | Personal Spending | Jun | 0.3% | 0.2% |
| 26-Jul | Real Personal Spending | Jun | 0.3% | 0.3% |
| 26-Jul | PCE Deflator YoY | Jun | 2.4% | 2.6% |
| 26-Jul | PCE Core Deflator YoY | Jun | 2.5% | 2.6% |
| 26-Jul | UM Consumer Sentiment | Jul F | 66.4 | 66.0 |
| 26-Jul | UM Current Conditions | Jul F | N/A | 64.1 |
| 26-Jul | UM Expectations | Jul F | N/A | 67.2 |
| 26-Jul | UM 1-yr inflation | Jul F | N/A | 2.9% |
| 26-Jul | UM 5-10-yr inflation | Jul F | N/A | 2.9% |
| 26-Jul | KC Fed Services Activity | Jul | N/A | 2 |
Mark Frears is a Senior Investment Advisor, Managing Director, at Texas Capital Bank Private Wealth Advisors. He holds a Bachelor of Science from The University of Washington, and an MBA from University of Texas – Dallas.
The contents of this article are subject to the terms and conditions available here.
Texas Capital Private Bank™ refers to the wealth management services offered by the bank and non-bank entities comprising the Texas Capital brand, including Texas Capital Bank Private Wealth Advisors (PWA). Nothing herein is intended to constitute an offer to sell or buy, or a solicitation of an offer to sell or buy securities.
Investing is subject to a high degree of investment risk, including the possible loss of the entire amount of an investment. You should carefully read and review all information provided by PWA, including PWA’s Form ADV, Part 2A brochure and all supplements thereto, before making an investment.
Neither PWA, the Bank nor any of their respective employees provides tax or legal advice. Nothing contained on this website (including any attachments) is intended as tax or legal advice for any recipient, nor should it be relied on as such. Taxpayers should seek advice based on the taxpayer’s particular circumstances from an independent tax advisor or legal counsel. The wealth strategy team at PWA can work with your attorney to facilitate the desired structure of your estate plan. The information contained on this website is not a complete summary or statement of all available data necessary for making an investment decision, and does not constitute a recommendation. The information has been obtained from sources considered to be reliable, but we do not guarantee that the foregoing material is accurate or complete. Any opinions are those of the authors and not necessarily those of PWA or the Bank.
©2025 Texas Capital Bank Wealth Management Services, Inc., a wholly owned subsidiary of Texas Capital Bank. All rights reserved.
Texas Capital Bank Private Wealth Advisors and the Texas Capital Bank Private Wealth Advisors logo are trademarks of Texas Capital Bancshares, Inc., and Texas Capital Bank.
www.texascapitalbank.com Member FDIC NASDAQ®: TCBI