Shelter — Week of June 3, 2024

Essential Economics
— Mark Frears
My kingdom for a generator
The past couple weeks in Texas have shown us how the weather can drive behavior. I see a much more direct link here than Fed rate hikes and less spending by consumers. Home ownership brings such joys as flooding, trees falling on roofs, hail, springtails, losing power (renters get this benefit also) and all the ancillary impacts like losing a freezer of food. A direct effect of weather can be an increase in generator purchases, and we are not even to the potential brownouts of summer.
With housing being the largest part of household’s budgets, let’s take a closer look at this sector.
Rent or buy?
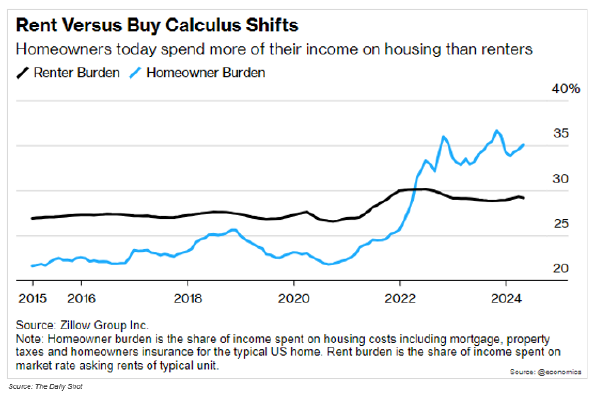
The first thing people learn when buying a house is that the mortgage payment is only part of the expense. The weather over the past couple weeks is evidence of that. The chart below shows that renters currently have an overall lower cost of housing.
Homeownership also varies by income level. As you can see below, until you get over $50,000 annual income, less than half of households own their home.
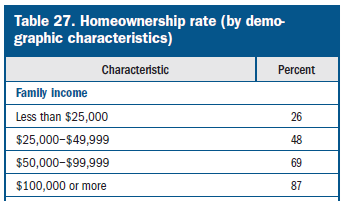
Source: Federal Reserve System — Economic Well-Being of U.S. Households in 2023
Cost
As mentioned above, the mortgage interest rate is one of the costs, but far from the only one. The chart below shows how mortgage interest rates have increased over the past decade.
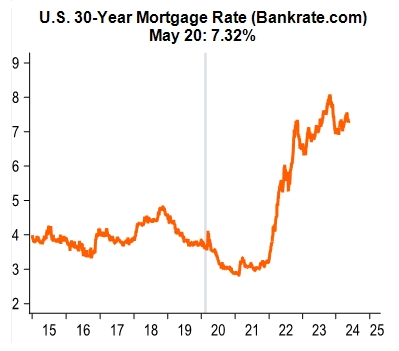
Source: Piper Sandler
In addition, as a reflection of higher building costs and higher natural disaster impact, insurance costs are increasing, often as much as 10%.
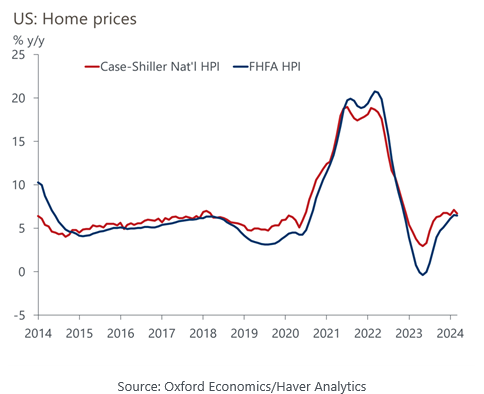
The biggest cost of owning a home is the price. We are well off the highs of 2022, but homes are still retaining their value. The chart below shows we are actually close to the average annual price increase, going back 10 years.
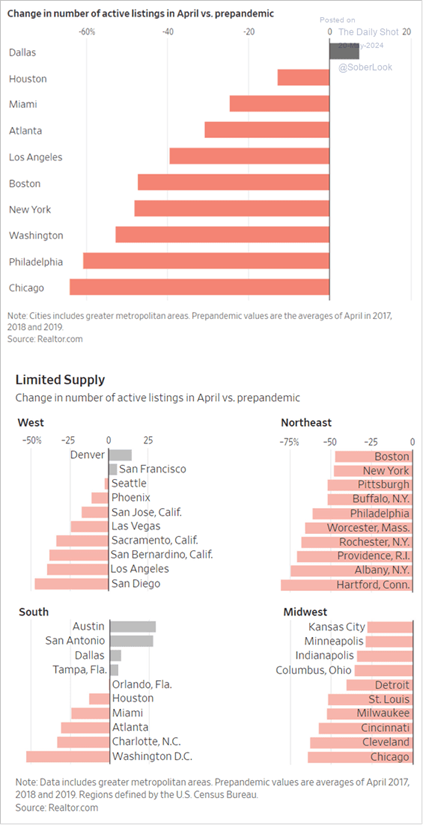
Another “cost” that is keeping this market from hitting the higher volumes of the traditional selling season is existing homeowners’ lower mortgage rates. They were able to lock in fixed rates during the period of low inflation and are reluctant to sell their house and pay significantly more for a new mortgage. The chart below shows the change in active listings as compared to the pre-pandemic period.
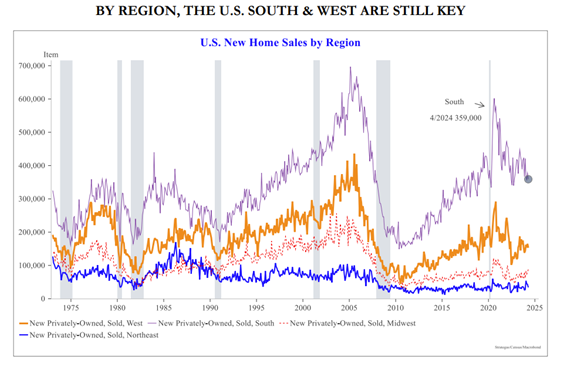
For those who are highly motivated to move, you can see below that the South and the West are seeing the most activity for new home purchases.
Source: Strategas Research
Good news
On the positive side, much of this concern in the housing market is driven by lack of supply. For homebuilders, such as Toll Brothers, this is an opportunity. As you can see below, their stock is up 17.1% year to date.

Source: FactSet
Economic releases
Last week we saw higher consumer confidence, but slightly lower consumer spending. Economy continues along in second gear. Fed talking heads stuck to the “higher for longer” mantra and are now in their quiet period ahead of the June 11-12 FOMC meeting.
This week’s calendar will be focused on employment. This is key to the housing market, as you must feel confident in your job to venture into this market. See below for details.
Wrap-Up
So, if you own a home with a low mortgage rate, you might be looking to fix it up and stay a while. If you are in the market for a house, be thankful you are not paying the higher costs, and wait for an opportunity. Wherever you lay your head down for the night, you are there for a reason.
| Upcoming Economic Releases: | Period | Expected | Previous | |
|---|---|---|---|---|
| 3-Jun | S&P Global US Manuf PMI | May F | 50.9 | 50.9 |
| 3-Jun | Construction Spending MoM | Apr | 0.2% | -0.2% |
| 3-Jun | ISM Manufacturing Index | May | 49.5 | 49.2 |
| 3-Jun | ISM Manufacturing Prices Paid | May | 59.0 | 60.9 |
| 3-Jun | ISM Manufacturing Employment | May | 49.4 | 48.6 |
| 3-Jun | ISM Manufacturing New Orders | May | 48.5 | 49.1 |
| 3-Jun | Ward's Total Vehicle Sales | May | 15,800,000 | 15,740,000 |
| 4-Jun | JOLTS Job Openings | Apr | 8,360,000 | 8,480,000 |
| 4-Jun | Factory Orders | Apr | 0.6% | 1.6% |
| 4-Jun | Factory Orders ex Transportation | Apr | 0.3% | 0.5% |
| 5-Jun | ADP Employment Change | May | 175,000 | 192,000 |
| 5-Jun | ISM Services Index | May | 51.0 | 49.4 |
| 5-Jun | ISM Services Prices Paid | May | N/A | 59.2 |
| 5-Jun | ISM Services Employment | May | N/A | 45.9 |
| 5-Jun | ISM Services New Orders | May | N/A | 52.2 |
| 6-Jun | Challenger Job Cuts YoY | May | N/A | -3.3% |
| 6-Jun | Nonfarm Productivity | Q1 | 0.1% | 0.3% |
| 6-Jun | Unit Labor Costs | Q1 | 4.9% | 4.7% |
| 6-Jun | Initial Jobless Claims | 1-Jun | 220,000 | 219,000 |
| 6-Jun | Continuing Claims | 25-May | 1,790,000 | 1,791,000 |
| 7-Jun | Change in Nonfarm Payrolls | May | 190,000 | 175,000 |
| 7-Jun | Change in Private Payrolls | May | 170,000 | 167,000 |
| 7-Jun | Unemployment Rate | May | 3.9% | 3.9% |
| 7-Jun | Avg Hourly Earnings MoM | May | 0.3% | 0.2% |
| 7-Jun | Avg Hourly Earnings YoY | May | 3.9% | 3.9% |
| 7-Jun | Avg Weekly Hours - All Employees | May | 34.3 | 34.3 |
| 7-Jun | Labor Force Participation Rate | May | 62.7% | 62.7% |
| 7-Jun | Underemployment Rate | May | N/A | 7.4% |
| 7-Jun | Consumer Credit | Apr | $10.000B | $6.274B |
Mark Frears is a Senior Investment Advisor, Managing Director, at Texas Capital Bank Private Wealth Advisors. He holds a Bachelor of Science from The University of Washington, and an MBA from University of Texas – Dallas.
The contents of this article are subject to the terms and conditions available here.
Texas Capital Private Bank™ refers to the wealth management services offered by the bank and non-bank entities comprising the Texas Capital brand, including Texas Capital Bank Private Wealth Advisors (PWA). Nothing herein is intended to constitute an offer to sell or buy, or a solicitation of an offer to sell or buy securities.
Investing is subject to a high degree of investment risk, including the possible loss of the entire amount of an investment. You should carefully read and review all information provided by PWA, including PWA’s Form ADV, Part 2A brochure and all supplements thereto, before making an investment.
Neither PWA, the Bank nor any of their respective employees provides tax or legal advice. Nothing contained on this website (including any attachments) is intended as tax or legal advice for any recipient, nor should it be relied on as such. Taxpayers should seek advice based on the taxpayer’s particular circumstances from an independent tax advisor or legal counsel. The wealth strategy team at PWA can work with your attorney to facilitate the desired structure of your estate plan. The information contained on this website is not a complete summary or statement of all available data necessary for making an investment decision, and does not constitute a recommendation. The information has been obtained from sources considered to be reliable, but we do not guarantee that the foregoing material is accurate or complete. Any opinions are those of the authors and not necessarily those of PWA or the Bank.
©2025 Texas Capital Bank Wealth Management Services, Inc., a wholly owned subsidiary of Texas Capital Bank. All rights reserved.
Texas Capital Bank Private Wealth Advisors and the Texas Capital Bank Private Wealth Advisors logo are trademarks of Texas Capital Bancshares, Inc., and Texas Capital Bank.
www.texascapitalbank.com Member FDIC NASDAQ®: TCBI