One way or the other — Week of October 2, 2023

Essential Economics
— Mark Frears
Extremes
What do you have to have? Some people collect things, like salt & pepper shakers. My Canadian grandmother had more sets than could fit in her dining room cabinet! I know, kind of strange, but once we get on a roll, greed can take over what was a fairly normal pastime. More is better, right? On the other extreme, what do you want nothing to do with? This might be something you want to avoid, or it can build in your mind to a full-blown fear! For me, it’s Bed, Bath & Beyond. Long story, based on historical events. Enough said.
Markets trade based on fundamentals, technicals and momentum caused by extreme viewpoints.
Current
CNN puts out a Fear & Greed Index that watches these extreme perspectives. As you can see below, we are currently in the Fear category, which makes perfect sense, given the market news.
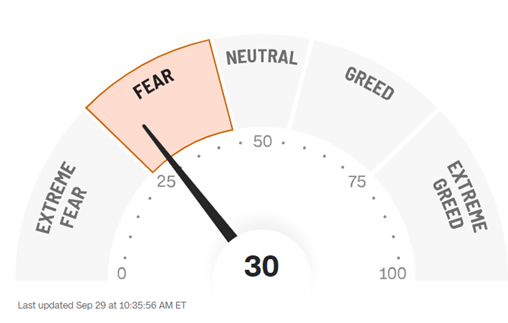
Source: CNN.com
There are seven different metrics that go into this indicator from the stock and bond markets. The metrics are market momentum, stock price strength, stock price breadth, put and call options, junk bond demand, market volatility, and safe haven demand. They are given equal weight in the calculation.
The premise is that too much fear tends to drive down stock prices and too much greed causes prices to rise.
Trend
Looking at the chart below, we can see when we hit the extremes on fear and greed. In the second chart below, we see the S&P 500 Index over the same period. While the first chart shows more volatility, we see the correlation between the two.
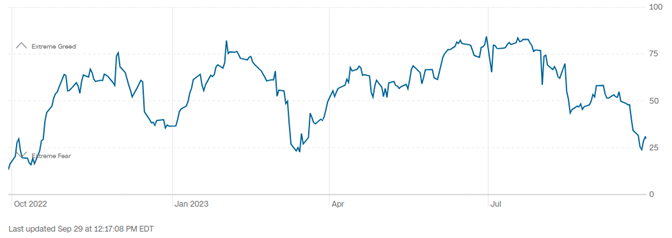
Source: CNN.com
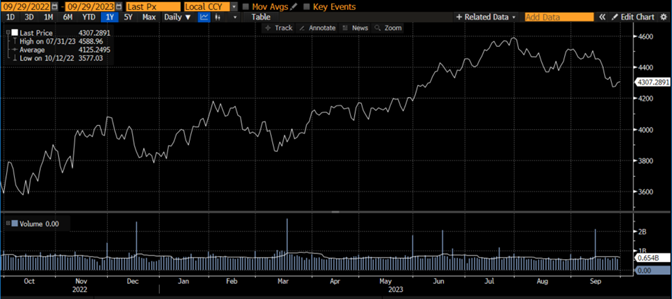
Source: Bloomberg
Coming influences
Looking ahead, most of the news would help the fear case. We have the ongoing UAW strike, which expanded to new plants for all three manufacturers, the government shutdown that was kicked down the road, higher long-term Treasury rates indicating the Fed will hold their target close to the current level for longer, and potential for energy prices to play out in lower corporate earnings over the next couple of quarters. On the greed side, the economy is still chugging along, and inflation is coming down, although the speed of the downtrend may not be fast enough for some.
Economic releases
Last week’s calendar continued to show a mixed bag regarding economic strength. We did have PCE numbers that showed inflation continuing to fall.
This week has employment front and center, watching JOLTS, ADP and Nonfarm Payrolls. In addition, we have Construction Spending, ISM, Factory Orders and Consumer Credit releases. See below for details.
Wrap-Up
Fear and greed can manifest themselves in many forms. The markets react to these same emotions. Pay attention. I can deal with fear in the markets, and I am very thankful Bed, Bath & Beyond is out of business.
| Upcoming Economic Releases: | Period | Expected | Previous | |
|---|---|---|---|---|
| 2-Oct | Construction Spending MoM | Aug | 0.5% | 0.7% |
| 2-Oct | ISM Manufacturing | Sep | 47.9 | 47.6 |
| 2-Oct | ISM Prices Paid | Sep | 49.0 | 48.4 |
| 2-Oct | ISM Employment | Sep | N/A | 48.5 |
| 2-Oct | ISM New Orders | Sep | N/A | 46.8 |
| 3-Oct | JOLTS Job Openings | Aug | 8,830,000 | 8,827,000 |
| 3-Oct | Ward’s Total Vehicle Sales | Sep | 15,350,000 | 15,040,000 |
| 4-Oct | ADP Employment Change | Sep | 150,000 | 177,000 |
| 4-Oct | Factory Orders | Aug | 0.4% | -2.1% |
| 4-Oct | Factory Orders ex Transportation | Aug | N/A | 0.8% |
| 4-Oct | ISM Services Index | Sep | 53.5 | 54.5 |
| 4-Oct | ISM Services Prices Paid | Sep | N/A | 58.9 |
| 4-Oct | ISM Services Employment | Sep | N/A | 54.7 |
| 4-Oct | ISM Services New Orders | Sep | N/A | 57.5 |
| 5-Oct | Challenger Job Cuts YoY | Sep | N/A | 266.9% |
| 5-Oct | Initial Jobless Claims | 30-Sep | 210,000 | 204,000 |
| 5-Oct | Continuing Claims | 23-Sep | 1,670,000 | 1,670,000 |
| 6-Oct | Change in Nonfarm Payrolls | Sep | 165,000 | 187,000 |
| 6-Oct | Change in Private Payrolls | Sep | 153,000 | 179,000 |
| 6-Oct | Unemployment Rate | Sep | 3.7% | 3.8% |
| 6-Oct | Avg Hourly Earnings MoM | Sep | 0.3% | 0.2% |
| 6-Oct | Avg Hourly Earnings YoY | Sep | 4.3% | 4.3% |
| 6-Oct | Labor Force Participation Rate | Sep | 62.8% | 62.8% |
| 6-Oct | Underemployment Rate | Sep | N/A | 7.1% |
| 6-Oct | Consumer Credit | Aug | $11.700B | $10.399B |
Mark Frears is a Senior Investment Advisor, Managing Director, , at Texas Capital Bank Private Wealth Advisors. He holds a Bachelor of Science from The University of Washington, and an MBA from University of Texas – Dallas.
The contents of this article are subject to the terms and conditions available here.