Too hot, too cold, or just right? — Week of September 11, 2023

Essential Economics
— Mark Frears
Temperature
I am wishfully thinking ahead to when temperatures are no longer in the 100s, and a breakfast of porridge will sound great. There are many varieties, from cream of wheat (with raisins, per my mother), Quaker Oats old school, Red River, or just the kind you dump in hot water. The key is the temperature and the texture — to have it not burn your tongue, yet still help you feel a nice warm comfort.
The temperature of the economy is measured by Gross Domestic Product (GDP). So, is this Goldilocks (“just right”) or one of the extremes?
What is GDP?
The sum of spending on domestically produced goods and services is the best picture of economic activity. GDP is composed of four categories of spending.
First, Consumption is goods and services purchased by households; it is the largest piece. Second, Investment creates new capital, by purchasing of equipment, inventories, and structures, including new housing expenditures. Third, Government includes Federal, State and Local spending. Transfer payments, such as Social Security, are not included as they are not payment for a currently produced good or service. Fourth, Net Exports are the purchases of domestically produced goods by non-U.S. consumers (exports) minus the domestic purchase of foreign goods (imports).
The contribution over the last five quarters is consistent, with Consumption making up 68%, Investment and Government each adding 17-18%, and Net Exports subtracting 3-4%. As you can see below, since the pandemic, we have been chugging along except for Q1 and Q2 in 2022.
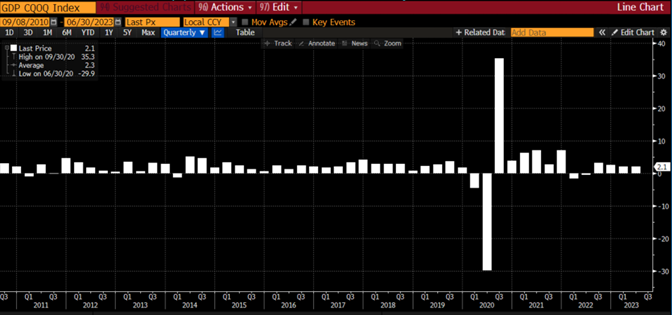
Source: Bloomberg
Current picture
The most recent release we have is for Q2 GDP. The 2.1% increase was surprising in that the expected slowdown/recession continues to get pushed further into the future. The Fed’s Summary of Economic Projections that last came out on June 14, 2023, showed they revised up their expectations for 2023 from 0.4% to 1.0%, as you can see below.
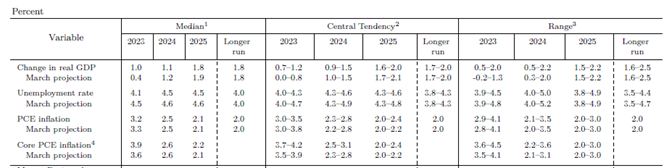
Source: FOMC Summary of Economic Projections
If you look over to the right-hand side of this table, you will see the previous projection had a possibility of a negative GDP in 2023. Overwhelmingly, economic growth has come in above expectations with the consumer continuing to spend.
Right now, we are ready to eat.
How foggy is your crystal ball?
While we have more inflation data coming out, and an upcoming Fed meeting, there is going to be a lot of focus on October 26. No, I am not going to see Taylor Swift; we will touch on her impact in a bit. Third-quarter GDP will be released at 7:30 a.m. CT!
As we have pushed the timing of the recession further out, the forecasts for Q3 have gone up. As seen below, forecasters have gone from a negative reading as of July 12 to the current forecast of 2.36%.
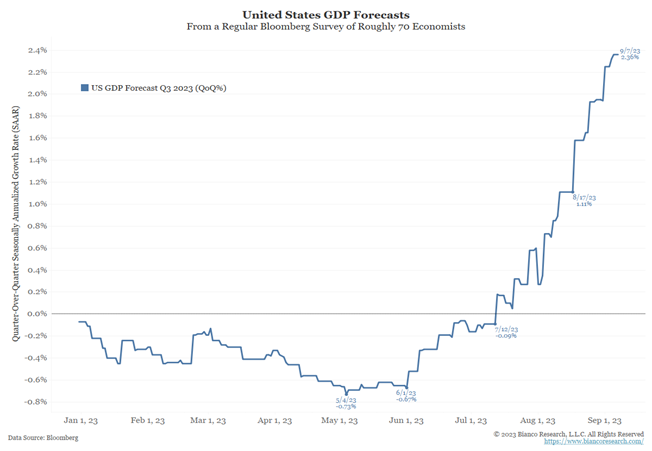
Source: Bloomberg
The Atlanta Fed does a weekly update to their forecast, and it has been running above the consensus. As you can see below, their forecast as of September 8 is 5.6%. Whoa.
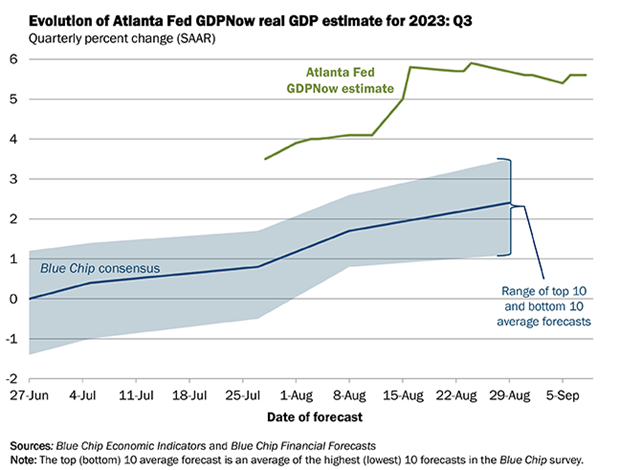
Source: Atlanta Fed
As the consumer continues to spend on services/experiences, the question is, when will the demand slow down? Morgan Stanley estimates Q3 real consumer spending is tracking 1.9%, on an annualized basis. Big one-time events like "Barbenheimer,” Taylor Swift’s “The Eras” tour, and Beyoncé’s “Renaissance” tour contributed 0.7% to consumption growth this quarter. Serious money.
When we look through the mist, this is setting up for a cooling in Q4. First, inflation is still taking a bigger chunk of their income, and second, as you can see below, excess savings have been used up.
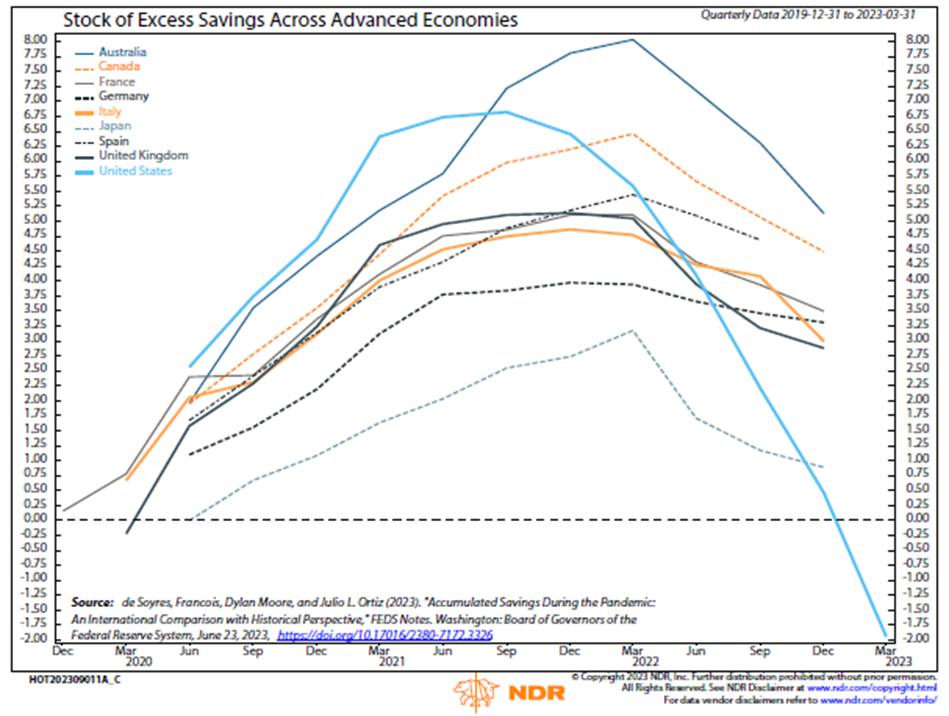
Source: Ned Davis Research
Third, student loan payments are kicking back in, as we see below. While this only impacts a subset of the economy, we can see the oatmeal losing its steam.
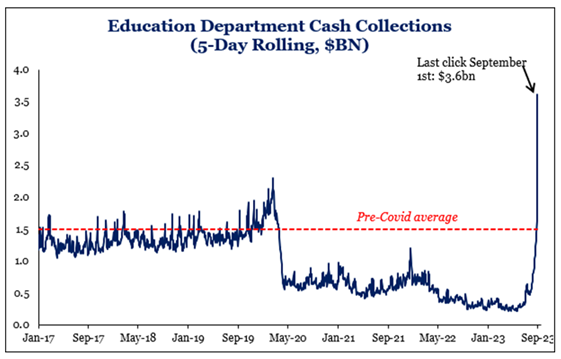
Source: Strategas
Fourth, as we noted last week, the strong labor market may not go on forever. As you see below, the smaller companies which provide much of the economic muscle are not adding as many new workers.
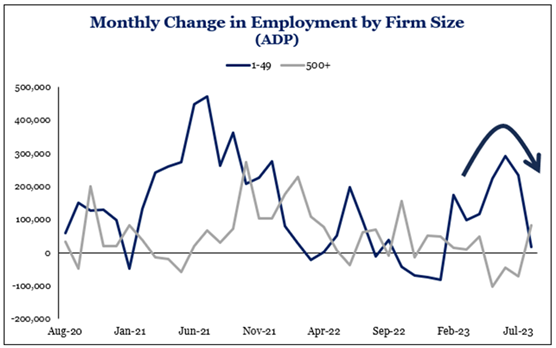
Source: Strategas
Fifth, the Conference Board’s Consumer Confidence release for August dropped by the most in two years. This indicator, as you can see below, tracks closer to employment conditions, versus the UM metric which is bent toward inflation expectations.
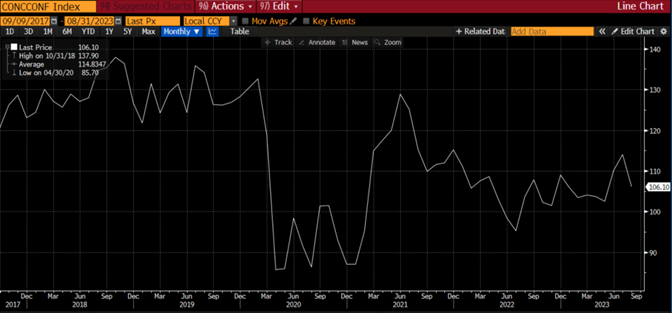
Source: Strategas
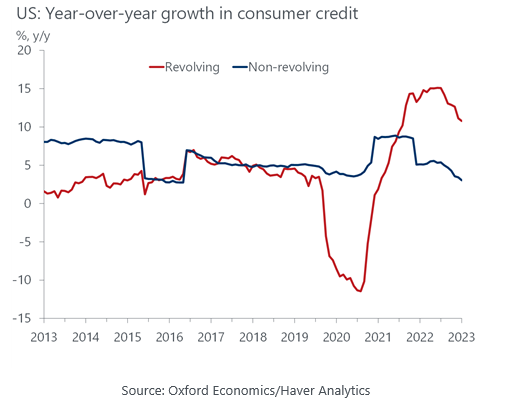
The other alternative for the consumer is to borrow, but this is slowing, either from less availability, higher cost or spending pullback. As you can see below, revolving (mostly credit cards) is slowing on a year-over-year basis.
The expectations for cooling porridge are increasing as the year progresses, but we have seen this movie before. Right now, it looks like the Fed will pause on any rate hikes in September, but the “talking heads” are not showing signs of being done if inflation and growth continue to heat things up.
Economic releases
Last week’s calendar was light, with ISM Services showing strength, Jobless Claims continuing to stay low and consumer credit pulling back.
This week is heavy with CPI, Retail Sales and PPI potentially bringing some volatility to the markets. See below for details.
Wrap-Up
Q3 is shaping up as almost too hot to eat, and we would like to see a little cooling, at least to placate the Fed. The question remains as to whether the burners are turned off in Q4, or just a bit lower.
| Upcoming Economic Releases: | Period | Expected | Previous | |
|---|---|---|---|---|
| 11-Sep | NY Fed 1-yr Inflation Expectations | Aug | N/A | 3.55% |
| 12-Sep | NFIB Small Business Optimism | Aug | 91.5 | 91.9 |
| 13-Sep | Consumer Price Index MoM | Aug | 0.6% | 0.2% |
| 13-Sep | CPI ex Food & Energy MoM | Aug | 0.2% | 0.2% |
| 13-Sep | Consumer Price Index YoY | Aug | 3.6% | 3.2% |
| 13-Sep | CPI ex Food & Energy YoY | Aug | 4.3% | 4.7% |
| 13-Sep | Real Avg Hourly Earnings YoY | Aug | N/A | 1.1% |
| 13-Sep | Real Avg Weekly Earnings YoY | Aug | N/A | 0.2% |
| 14-Sep | Retail Sales | Aug | 0.1% | 0.7% |
| 14-Sep | Retail Sales ex Autos | Aug | 0.4% | 0.1% |
| 14-Sep | Initial Jobless Claims | 9-Sep | 227,000 | 216,000 |
| 14-Sep | Continuing Claims | 2-Sep | 1,695,000 | 1,679,000 |
| 14-Sep | Producer Price Index MoM | Aug | 0.4% | 0.3% |
| 14-Sep | PPI ex Food & Energy MoM | Aug | 0.2% | 0.3% |
| 14-Sep | Producer Price Index YoY | Aug | 1.3% | 0.8% |
| 14-Sep | PPI ex Food & Energy YoY | Aug | 2.2% | 2.4% |
| 14-Sep | Business Inventories | Jul | 0.1% | 0.0% |
| 15-Sep | Import Price Index MoM | Aug | 0.3% | 0.4% |
| 15-Sep | Export Price Index MoM | Aug | 0.3% | 0.7% |
| 15-Sep | Empire Manufacturing | Sep | (10.0) | (19.0) |
| 15-Sep | Industrial Production MoM | Aug | 0.1% | 1.0% |
| 15-Sep | Capacity Utilization | Aug | 79.3% | 79.3% |
| 15-Sep | UM (Go UW) Consumer Sentiment | Sep | 69.2 | 69.5 |
| 15-Sep | UM (Go UW) Current Conditions | Sep | 74.5 | 75.7 |
| 15-Sep | UM (Go UW) Expectations | Sep | 66.0 | 65.5 |
| 15-Sep | UM (Go UW) 1-yr inflation | Sep | 3.5% | 3.5% |
| 15-Sep | UM (Go UW) 5- to 10-yr inflation | Sep | 3.0% | 3.0% |
Mark Frears is a Senior Investment Advisor, Managing Director, at Texas Capital Bank Private Wealth Advisors. He holds a Bachelor of Science from The University of Washington, and an MBA from University of Texas – Dallas.
The contents of this article are subject to the terms and conditions available here.