How fast and how big? — Week of September 18, 2023

Essential Economics
— Mark Frears
Are we there yet?
Every day, as I get on the road home, I must prepare myself. Will this be a race day, or a take-it-easy day? I can very easily get caught up in “beat the next car,” weaving in and out until I reach the next backup and then I am sitting right next to the car I so desperately wanted to pass. If I am in the right frame of mind, I can listen to my audiobook, cruise along and get home in a much better place. Sounds easy; but it’s not. Just like your car, bike, boat or plane, money can go fast or slow.
Money supply
The Federal Reserve measures the amount of money at various degrees of liquidity, or spendability, and prior to 2000 these measures were watched closely as they correlated well with economic activity. Since then, it is still watched due to the influence the amount of and speed that money moves can have on the overall economy.
The M1 category measures the most liquid forms, primarily currency and readily available deposits in banks. M2 is M1 plus savings accounts, smaller time deposits, and balances in retail money market mutual funds. This is considered the best measure to watch, as it covers a broad spectrum of money that can have an influence on the economy.
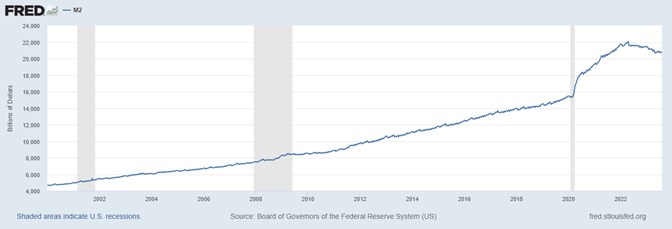
Source: Board of Governors of the Federal Reserve System (US)
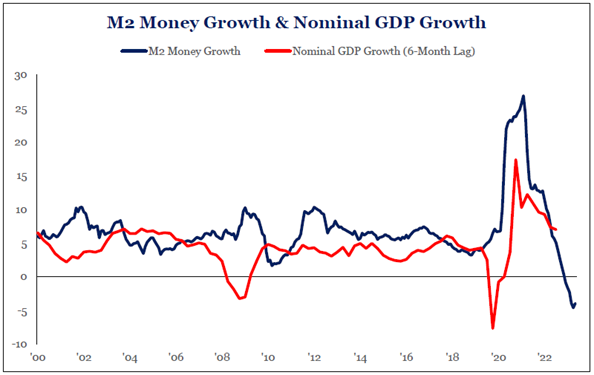
As you can see from the chart above, the amount of money in the M2 category increased up to the 2020 pandemic shutdown then continued the climb as liquidity was provided. It is only as we have entered quantitative tightening that we have slowed down the growth, at least moderately.
“I feel the need, the need for speed.”
We talked about the speed of my car; now let’s look at how that relates to money. The velocity is defined as the rate at which money is exchanged in the economy. The number of times one unit of money is spent to buy goods and services per unit of time.
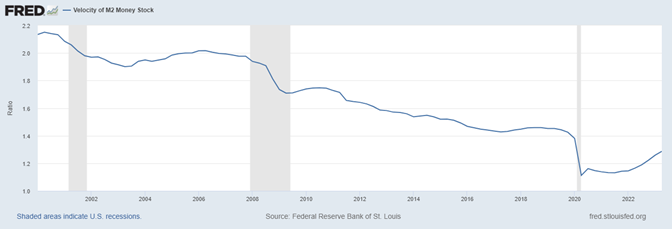
Source: Federal Reserve Bank of St.Louis
As you would expect, the velocity slows during the pandemic shutdown shown in the shaded areas above. Right after the recent pandemic shutdown, due to stimulus provided to the economy, we see the speed increase. After the initial increase, you will see a slowing. The primary driver of this lower velocity is the increasing amount of money in the system. This relationship is dependent upon the value of money remaining stable, as it has.
Since the last recession, we have seen velocity take an upward turn. This is reflective of less money in the system and the economy still ticking along.
Pace
If you combine supply with velocity (inversely related to demand), you get the graph below. The faster supply growth relative to demand can be seen in the period after the last recession in a steeper line below.
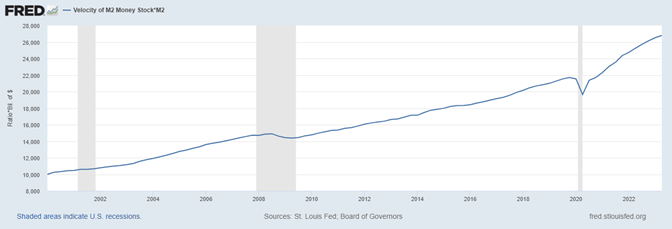
Source: St. Louis Fed Board of Governors
One of the concerns of monetarists is that the accelerated growth rate of supply relative to demand could cause inflationary tendencies. As this shows, the amount of money poured into the system after the pandemic is still causing inflation. Too much money chasing too few goods.
As always, when you must look at the broader picture, inflation has peaked as indicated by Consumer Price Index and Personal Consumption Expenditures. The level of inflation is still a concern, so the Fed and Money Supply will continue to be kept top-of-mind.
Market impact
We saw the contracting money supply in the first chart above and this is an indicator of coming economic slowing. While this helps with fighting inflation, it generally has an input on corporate profits, as you can see below.
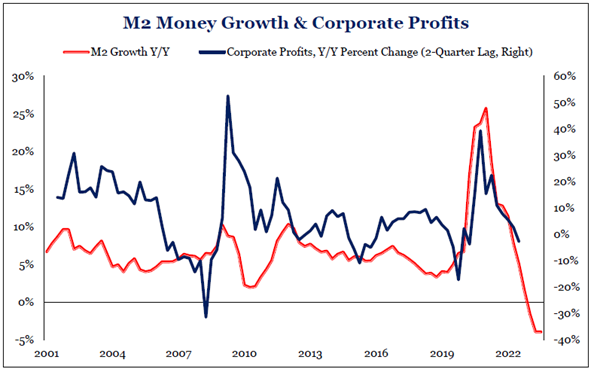
Source: Strategas Research
As a follow-through, this will hit Gross Domestic Product (GDP), as seen below.
Source: Strategas Research
While money supply is an “old school” metric and doesn’t get the attention it used to, it is still a very important tool with regards to inflation and the economy.
Economic releases
Last week’s calendar was loaded with inflation news. CPI and PPI both came in higher than last month on a year-over-year basis. UM inflation picture was lower, even considering higher gas prices.
This week we turn to housing and the Wednesday FOMC meeting. No rate move expected but they will be updating their quarterly projections for growth and inflation. See below for details.
Wrap-Up
So, at whatever pace you are traveling, remember to keep in mind that the journey is just as important as the destination.
| Upcoming Economic Releases: | Period | Expected | Previous | |
|---|---|---|---|---|
| 18-Sep | NY Fed Services Business Activity | Sep | N/A | 0.6 |
| 18-Sep | NAHB Housing Market Index | Sep | 49 | 50 |
| 19-Sep | Building Permits | Aug | 1,440,000 | 1,442,000 |
| 19-Sep | Building Permits MoM | Aug | -0.2% | 0.1% |
| 19-Sep | Housing Starts | Aug | 1,437,000 | 1,452,000 |
| 19-Sep | Housing Starts MoM | Aug | -1.0% | 3.9% |
| 20-Sep | FOMC Rate Decision (Upper Bound) | 1p CT | 5.50% | 5.50% |
| 20-Sep | FOMC Rate Decision (Lower Bound) | 1p CT | 5.25% | 5.25% |
| 21-Sep | Initial Jobless Claims | 16-Sep | 225,000 | 220,000 |
| 21-Sep | Continuing Claims | 9-Sep | 1,695,000 | 1,688,000 |
| 21-Sep | Philadelphia Fed Business Outlook | Sep | (1.0) | 12.0 |
| 21-Sep | Existing Home Sales | Aug | 4,100,000 | 4,070,000 |
| 21-Sep | Existing Home Sales MoM | Aug | 0.7% | -2.2% |
| 21-Sep | Leading Index | Aug | -0.5% | -0.4% |
| 22-Sep | S&P Global US Manufacturing PMI | Sep | 48.2 | 47.9 |
| 22-Sep | S&P Global US Services PMI | Sep | 50.6 | 50.5 |
| 22-Sep | S&P Global US Composite PMI | Sep | 50.3 | 50.2 |
Mark Frears is a Senior Investment Advisor, Managing Director, at Texas Capital Bank Private Wealth Advisors. He holds a Bachelor of Science from The University of Washington, and an MBA from University of Texas – Dallas.
The contents of this article are subject to the terms and conditions available here.