Home Sweet Home — Week of September 25, 2023

Essential Economics
— Mark Frears
Texas heat
We are hopefully through the 100-degree temperatures, and while I have no problem with these hot days, my house does. Two months of severe heat dries out the clay soil, and if you don’t continually keep it watered, there will be separation between the dirt and the foundation. This is not good. If your foundation is not solid, you have issues. Cracks in the brick on the outside, cracks in the interior Sheetrock around windows and doors, plus doors that don’t fit are a few of the ramifications.
Your house is most likely the largest asset in your portfolio. It is not necessarily going to appreciate in value (shocking revelation for some); it is primarily a place to make your home, and it is your largest concern monetarily. Let’s look at this significant area of the economy.
Shelter
Whether you live in a five-bedroom house or a studio apartment, you have a monthly cost that must be paid, or you will be laying your head down to sleep in a different location. Most likely you have worked out how to pay for this abode, and if you locked in a mortgage when rates were low, you are doing okay.
Given the current environment, this picture becomes much more complicated if you decide you want to relocate. The first lesson of residential real estate is location, location, location. You can have a shack in a desired location that may have huge value, or a multi-bedroom house in a bad area that is worth little. The current perspective can be seen below, in how long a house stays on the market.
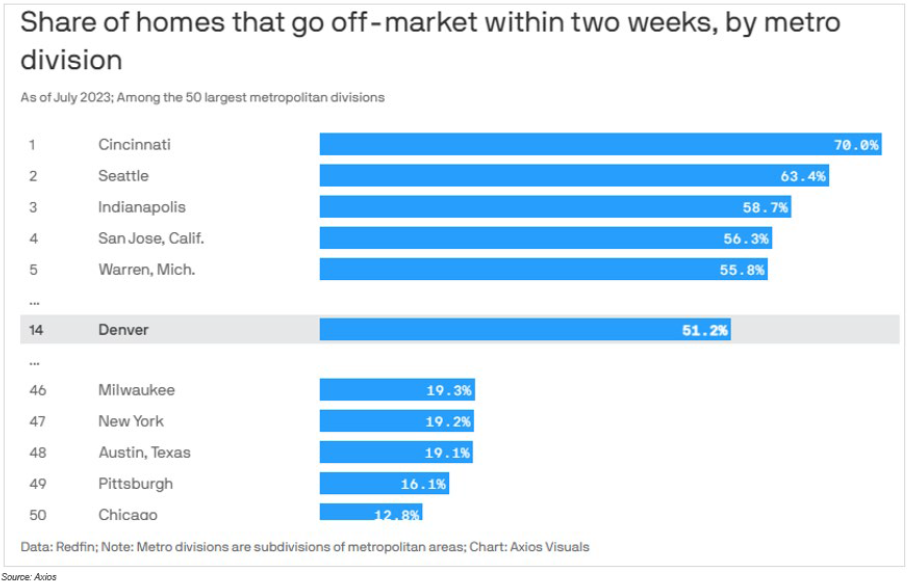
Source: Axios
Next question, are you a buyer, a seller, or both? Due to lack of supply and continuing demand, a seller has the upper hand now. As you can see below, supply of existing homes is at historical lows, and we are entering the time of the year when there are normally even fewer on the market.
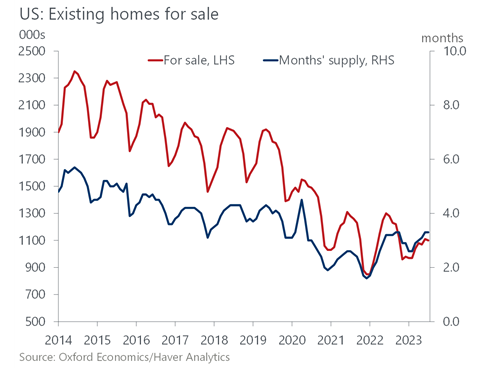
Source: Oxford Economics/Haver Analytics
As there are still people wanting to buy homes, this lower supply is causing prices to stay at elevated levels. Good for the seller, not so much for the buyer. A paper from the San Francisco Fed shows prices declining, but unless supply increases, this will not be material, especially in highly desired areas. Another issue the buyer has is that we were spoiled by very low mortgage rates during the days of extremely low short-term rates and commensurate low longer-term rates. Now, as can be seen below, your mortgage payment is significantly higher.
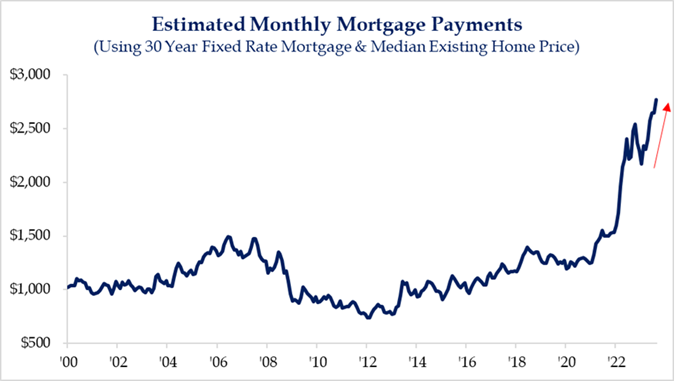
Source: Strategas Research
While these rates do not compare to the high-inflation times in the 1970s, people who were used to the low rates now find they cannot buy as much house as they could previously, given the same payment.
If you look outside the house market to apartments, the demand for shelter is there as well, causing rents to increase. The chart below from the Federal Reserve Bank of Atlanta shows the impact to a household’s budget.
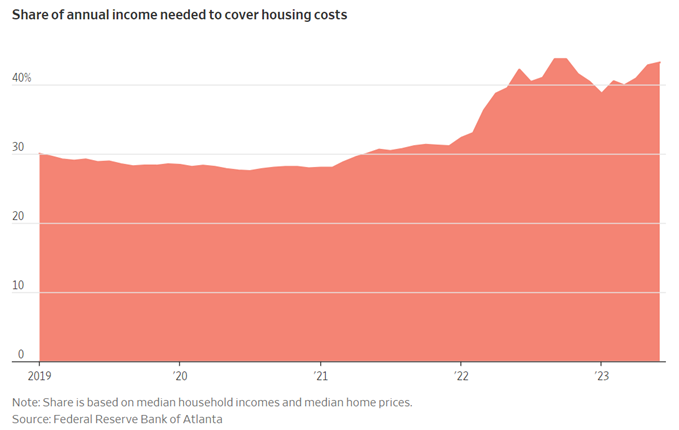
Source: Federal Reserve Bank of Atlanta
While your desire to buy a home may be strong, it still makes sense to evaluate rent versus buying. Realtor.com found that renting a starter home is a more affordable option than buying in all but three of the largest U.S. cities. As my father-in-law was fond of saying, “sometimes you have to put pencil to paper.” If we compare buying now versus buying a year ago, we can see the higher costs.
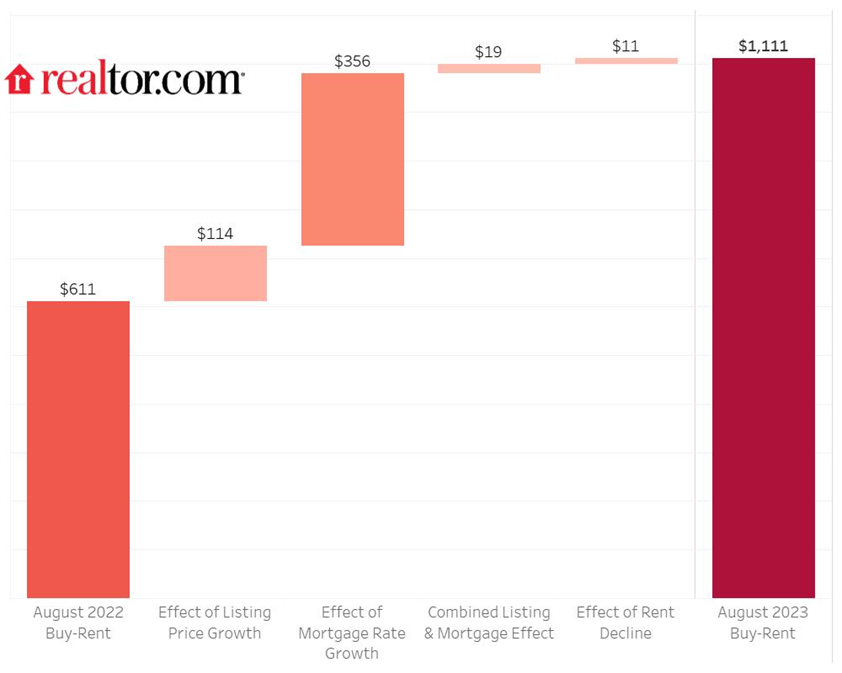
Source: Realtor.com
As you can see in the chart above, in August of 2022, the average buyer paid $611 more per month than a comparable renter. Over the past year, we move to the right-hand column, where the same buyer is now paying $1,111 more than the renter, primarily due to increased price and higher mortgage rate.
Your place of living is much more than a building, but the dynamics here are driving decisions that may not all be in your control.
Builders
All these houses and apartments have to come from somewhere, and this past week we had the most recent update on Housing Starts and Building Permits. We saw a steep decline in the August Housing Starts, but this was primarily due to the more volatile multi-family sector. Housing Starts are expected to moderate as winter approaches and high mortgage rates inhibit demand, although the underlying demand will limit this downward trend.
Building Permits are considered a more leading indicator, and they improved 6.9% in August with gains in both single- and multi-family permits. As you can see below, single-family is on a stronger upward trend, which makes sense given the significant falloff in recent years.
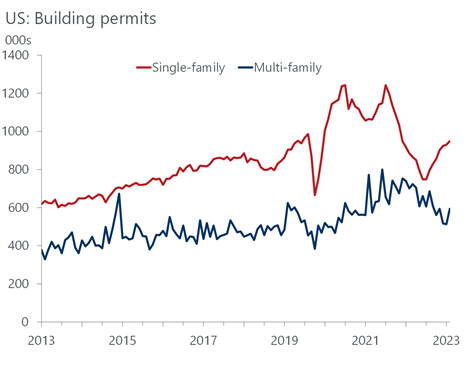
Source: Oxford Economics/Haver Analytics
We also had the Leading Indicators out this past week, with a negative 3.8% continuing the 18-month trend of pointing toward a coming weakness in the economy. As you can see below, Building Permits were the major contributor against this trend.
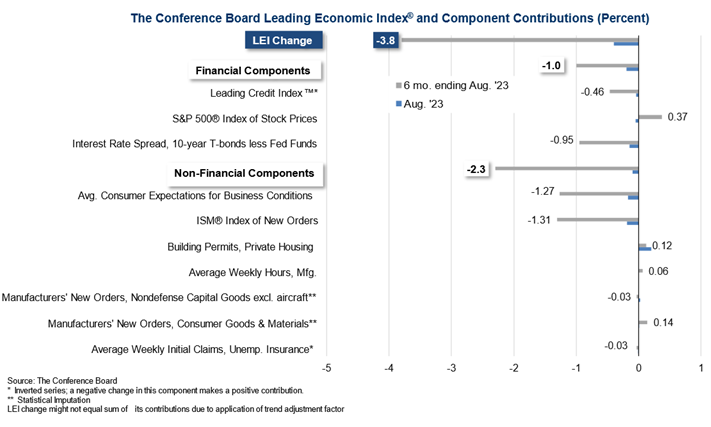
Source: The Conference Board
As builders battle inflation on both the labor and materials fronts, they will continue to attempt to fill this supply gap.
Economic releases
Last week’s calendar was highlighted by the Fed’s pause in rate movements, and the market finally got the notice that they will leave rates higher for longer. This caused the 10-year UST to move up to the 4.50% level and the 2-year UST to move above 5.10%.
This week has a full slate, as you can see below. The UAW strike, looming U.S. government shutdown and significant historical GDP revisions will add to the volatility.
Wrap-Up
The housing sector affects each of us on a daily basis. In addition, the secondary and tertiary impact affects a wide swath of industries. Keep an eye on this very important area. I am about to get a raise, with the water and electricity (A/C) bills about to drop; maybe it will be enough to start on foundation work.
| Upcoming Economic Releases: | Period | Expected | Previous | |
|---|---|---|---|---|
| 25-Sep | Chicago Fed Natl Activity Index | Aug | 0.05 | 0.12 |
| 25-Sep | Dallas Fed Manuf Activity | Sep | (13.0) | (17.2) |
| 26-Sep | Philadelphia Fed Non-Manuf Activity | Sep | N/A | (13.1) |
| 26-Sep | FHFA House Price Index MoM | Jul | 0.4% | 0.3% |
| 26-Sep | S&P CoreLogic 20-City YoY NSA | Jul | 0.03% | -1.17% |
| 26-Sep | New Home Sales | Aug | 699,000 | 714,000 |
| 26-Sep | New Home Sales MoM | Aug | -2.2% | 4.4% |
| 26-Sep | Conf Board Consumer Confidence | Sep | 105.5 | 106.1 |
| 26-Sep | Conf Board Present Situation | Sep | N/A | 144.8 |
| 26-Sep | Conf Board Expectations | Sep | N/A | 80.2 |
| 26-Sep | Richmond Fed Manufacturing Index | Sep | (7) | (7) |
| 26-Sep | Richmond Fed Business Conditions | Sep | N/A | 1 |
| 26-Sep | Dallas Fed Services Activity | Sep | N/A | (2.7) |
| 27-Sep | Durable Goods Orders | Aug | -0.5% | -5.2% |
| 27-Sep | Durable Goods ex Transportation | Aug | 0.1% | 0.4% |
| 27-Sep | Cap Goods Orders Nondef ex Aircraft | Aug | 0.1% | 0.1% |
| 28-Sep | Initial Jobless Claims | 23-Sep | 215,000 | 201,000 |
| 28-Sep | Continuing Claims | 16-Sep | 1,675,000 | 1,662,000 |
| 28-Sep | GDP Annualized QoQ | Q2 | 2.2% | 2.1% |
| 28-Sep | Personal Consumption | Q2 | 1.7% | 1.7% |
| 28-Sep | GDP Price Index | Q2 | 2.0% | 2.0% |
| 28-Sep | Pending Home Sales MoM | Jul | -1.0% | 0.9% |
| 28-Sep | KC Fed Manufacturing Activity | Sep | (2) | 0 |
| 29-Sep | Wholesale Inventories MoM | Aug | -0.2% | -0.2% |
| 29-Sep | Retail Inventories MoM | Aug | 0.5% | 0.3% |
| 29-Sep | Personal Income | Aug | 0.4% | 0.2% |
| 29-Sep | Personal Spending | Aug | 0.4% | 0.8% |
| 29-Sep | Real Personal Spending | Aug | 0.0% | 0.6% |
| 29-Sep | PCE Deflator YoY | Aug | 3.5% | 3.3% |
| 29-Sep | PCE Core Deflator YoY | Aug | 3.9% | 4.2% |
| 29-Sep | MNI Chicago PMI | Sep | 47.5 | 48.7 |
| 29-Sep | UM (Go MSU) Consumer Sentiment | Sep | 67.7 | 67.7 |
| 29-Sep | UM (Go MSU) Current Conditions | Sep | N/A | 69.8 |
| 29-Sep | UM (Go MSU) Expectations | Sep | N/A | 66.3 |
| 29-Sep | UM (Go MSU) 1-yr inflation | Sep | N/A | 3.1% |
| 29-Sep | UM (Go MSU) 5- to 10-yr inflation | Sep | N/A | 2.7% |
| 29-Sep | KC Fed Services Activity | Sep | N/A | (1) |
Mark Frears is a Senior Investment Advisor, Managing Director, at Texas Capital Bank Private Wealth Advisors. He holds a Bachelor of Science from The University of Washington, and an MBA from University of Texas – Dallas.
The contents of this article are subject to the terms and conditions available here.