U.S. Consumer — Week of September 9, 2024

Essential Economics
— Mark Frears
U.S. households
Do you like breakfast for dinner? At our house, we do, and apparently, we are not alone.
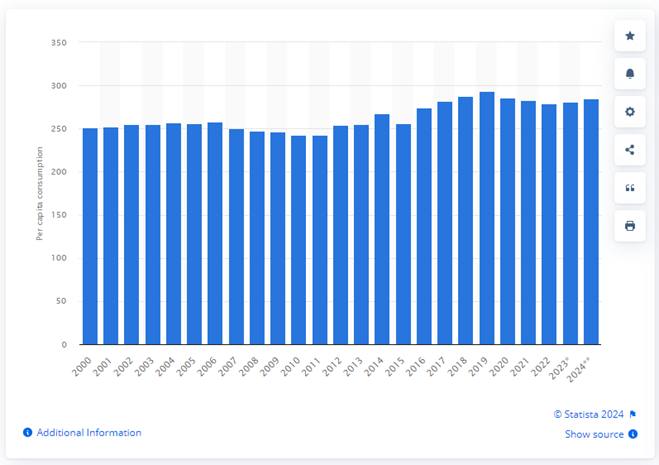
Eggs are great in everything from omelets to French toast, to over-easy on top of pancakes. Yum. They have even been used on the ice in hockey practices, as seen in the original Mighty Ducks flick. Classic. Can you make a soft catch?
The current economy is probably in a soft-boiled state. Not solid like a hard-boiled egg, but not fragile either. Let’s take a look at what U.S. households are thinking.
Fed study
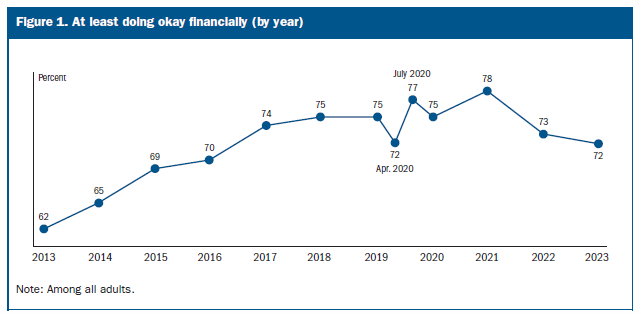
Most people think the economy is doing OK. They have jobs, but inflation is still having an impact. The Fed study we are looking at shows that people in 2023 felt about the same from a financial well-being state as in 2022. The Survey of Household Economics and Decision Making (SHED) is done by the Federal Reserve Bank on an annual basis: https://www.federalreserve.gov/publications/files/2023-report-economic-well-being-us-households-202405.pdf. This study was published in May 2024, based on data gathered in October 2023. As you can see below, we are on a downward trend.
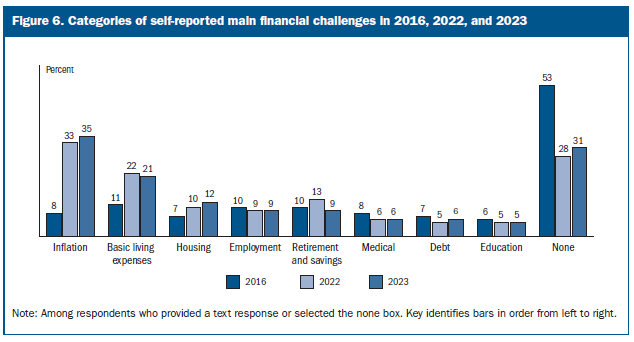
Inflation continues to be the top financial concern, even as we have seen improvement here.
Employment
Coming out of the pandemic, we hear much about working from home. The chart below shows the current state by education level.
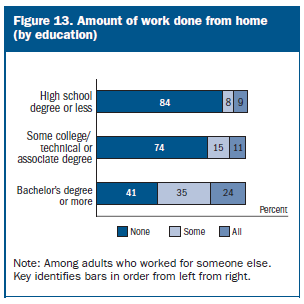
In 2023, 16% worked fully from home, while 23% did so some of the time. Prior to the pandemic, only 7% worked mostly from home.
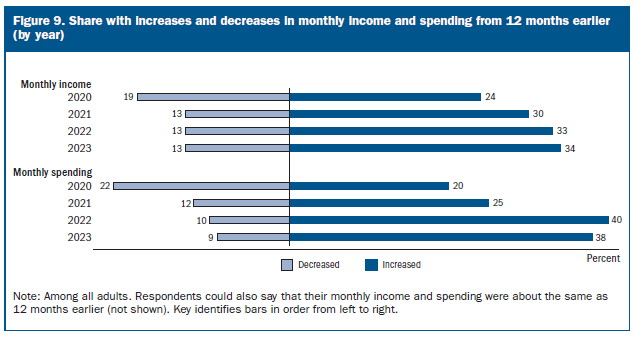
There were changes to both income and spending from the previous year. As you see below, income increased by 34%, but that did not keep pace with expenses going up by 38%.
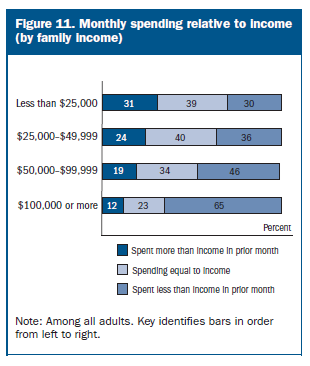
The chart below shows how lower-income families tend to spend more than their income. They cannot keep up with higher costs, showing the fight against inflation is not over.
Emergency, or unexpected, expenses can often derail a budget. The chart below shows that households were at the same place in 2023 as in 2022. Sixty-three percent of them could meet a $400 expense with cash.
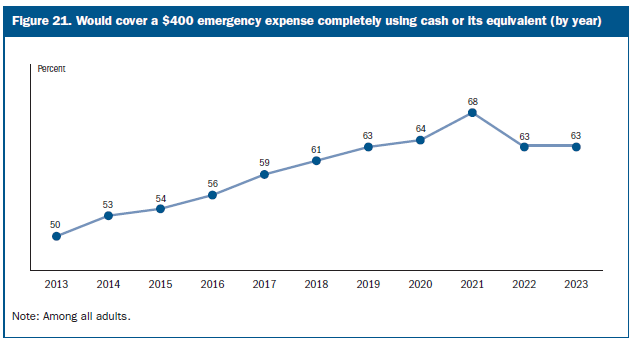
This is back to pre-pandemic levels, but it would be good to see the prior uptrend continue.
Housing
This category is the largest component of households’ budgets. Sixty-four percent of families own their homes, and two-thirds of those had a mortgage. As you can see below, the median monthly mortgage payment was $1,500.
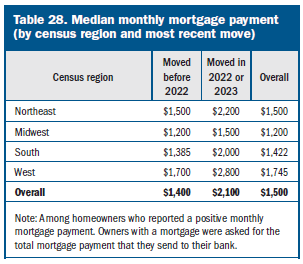
There is significant variability based on the region of the country and how recently you moved. What caught my eye was the difference between moving after 2022. This added, on average, $700 to your payment. An increase of 50%.
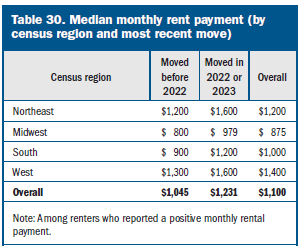
Those who rented, by choice or necessity, faced slightly lower expenses. As seen below, median overall rent was $1,100.
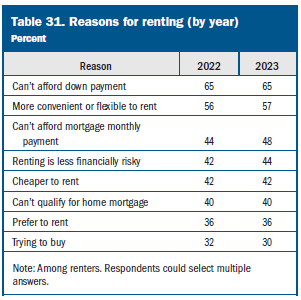
The reasons for renting were very similar to 2022, as you can see below.
Retirement and investments
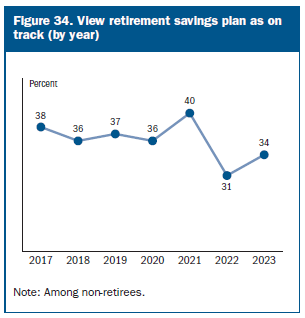
If you are not retired yet, how are you doing in saving/preparing for this significant life event? Per the chart below, only 34% feel they are on track, but this is up from 31% in 2022.
As for the ones already at this stage, 27% of adults, how are they doing? Four percent of retirees are still working. The chart below shows the range of financial well-being among those in retirement.
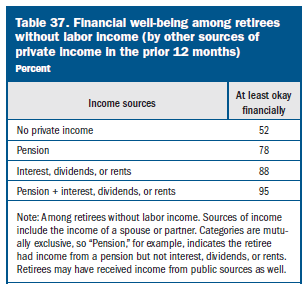
As you can see, the ones relying fully on social security are less OK.
If they have investments to rely on, there is a wide range of comfort in managing those assets. The chart below breaks this out by investable assets and gender.
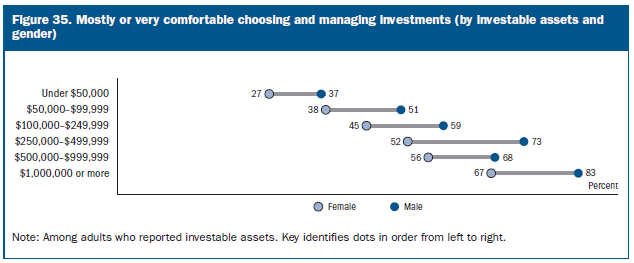
Looks like an opportunity for investment advisors to come alongside people!
Possibly, this view makes you feel like you are doing OK, or maybe it opens your eyes to how many are living from a financial well-being perspective. The economy seems to be chugging along, with a few cracks starting to show. The question now is whether a Fed easing will have an impact, or whether this is a hopeful move toward a soft landing. Stay tuned.
Economic releases
Last week was all about jobs, and the picture is of a slowing labor market, but not one contracting.
This week’s calendar is all about inflation, with the all-important last major indicator before the FOMC meeting on September 17-18. CPI is the headliner, but we also have PPI, Consumer Credit and Consumer Sentiment. See below for more details.
Wrap-Up
The cost of eggs did skyrocket during and after the pandemic, but it didn’t seem to slow demand. What are essential items for your family, and what are you willing to give up in order to have them?
| Upcoming Economic Releases: | Period | Expected | Previous | |
|---|---|---|---|---|
| 9-Sep | NY Fed 1-yr inflation expectations | Aug | N/A | 2.97% |
| 9-Sep | Consumer Credit | Jul | $11.200B | $8.934B |
| 10-Sep | NFIB Small Business Optimism | Aug | 93.7 | 93.7 |
| 10-Sep | First Presidential Debate | 8p CT | ||
| 11-Sep | Consumer Price Index MoM | Aug | 0.2% | 0.2% |
| 11-Sep | CPI ex Food & Energy MoM | Aug | 0.2% | 0.2% |
| 11-Sep | Consumer Price Index YoY | Aug | 2.5% | 2.9% |
| 11-Sep | CPI ex Food & Energy YoY | Aug | 3.2% | 3.2% |
| 11-Sep | Real Avg Hourly Earnings YoY | Aug | N/A | 0.7% |
| 11-Sep | Real Avg Weekly Earnings YoY | Aug | N/A | 0.4% |
| 12-Sep | Initial Jobless Claims | 7-Sep | 227,000 | 227,000 |
| 12-Sep | Continuing Claims | 31-Aug | 1,850,000 | 1,838,000 |
| 12-Sep | Producer Price Index MoM | Aug | 0.2% | 0.1% |
| 12-Sep | PPI ex Food & Energy MoM | Aug | 0.2% | 0.0% |
| 12-Sep | Producer Price Index YoY | Aug | 1.7% | 2.2% |
| 12-Sep | PPI ex Food & Energy YoY | Aug | 2.4% | 2.4% |
| 12-Sep | Household change in Net Worth | Q2 | N/A | $5,117B |
| 12-Sep | Monthly Budget Statement | Aug | -$276.0B | -$243.7B |
| 13-Sep | Import Price Index MoM | Aug | -0.2% | 0.1% |
| 13-Sep | Export Price Index MoM | Aug | -0.1% | 0.7% |
| 13-Sep | UM Consumer Sentiment | Sep P | 68.3 | 67.9 |
| 13-Sep | UM Current Conditions | Sep P | 61.5 | 61.3 |
| 13-Sep | UM Expectations | Sep P | 70.5 | 72.1 |
| 13-Sep | UM 1-yr inflation | Sep P | 2.7% | 2.8% |
| 13-Sep | UM 5-10-yr inflation | Sep P | 3.0% | 3.0% |
Mark Frears is a Senior Investment Advisor, Managing Director, at Texas Capital Bank Private Wealth Advisors. He holds a Bachelor of Science from The University of Washington, and an MBA from University of Texas – Dallas.
The contents of this article are subject to the terms and conditions available here.
Texas Capital Private Bank™ refers to the wealth management services offered by the bank and non-bank entities comprising the Texas Capital brand, including Texas Capital Bank Private Wealth Advisors (PWA). Nothing herein is intended to constitute an offer to sell or buy, or a solicitation of an offer to sell or buy securities.
Investing is subject to a high degree of investment risk, including the possible loss of the entire amount of an investment. You should carefully read and review all information provided by PWA, including PWA’s Form ADV, Part 2A brochure and all supplements thereto, before making an investment.
Neither PWA, the Bank nor any of their respective employees provides tax or legal advice. Nothing contained on this website (including any attachments) is intended as tax or legal advice for any recipient, nor should it be relied on as such. Taxpayers should seek advice based on the taxpayer’s particular circumstances from an independent tax advisor or legal counsel. The wealth strategy team at PWA can work with your attorney to facilitate the desired structure of your estate plan. The information contained on this website is not a complete summary or statement of all available data necessary for making an investment decision, and does not constitute a recommendation. The information has been obtained from sources considered to be reliable, but we do not guarantee that the foregoing material is accurate or complete. Any opinions are those of the authors and not necessarily those of PWA or the Bank.
©2025 Texas Capital Bank Wealth Management Services, Inc., a wholly owned subsidiary of Texas Capital Bank. All rights reserved.
Texas Capital Bank Private Wealth Advisors and the Texas Capital Bank Private Wealth Advisors logo are trademarks of Texas Capital Bancshares, Inc., and Texas Capital Bank.
www.texascapitalbank.com Member FDIC NASDAQ®: TCBI