Fed fighting the last war — Week of December 19, 2022

Strategy and Positioning written by Steve Orr, Chief Investment Officer; and Essential Economics written by Mark Frears, Investment Advisor
| index | wtd | ytd | 1-year | 3-year | 5-year | index level |
|---|---|---|---|---|---|---|
| S&P 500 Index | -2.05 | -17.90 | -16.16 | 8.19 | 9.45 | 3,852.36 |
| Dow Jones Industrial Average | -1.65 | -7.50 | -6.36 | 7.41 | 8.28 | 32,920.46 |
| Russell 2000 Small Cap | -1.81 | -20.43 | -16.95 | 3.34 | 4.19 | 1,763.42 |
| NASDAQ Composite | -2.70 | -31.00 | -28.87 | 7.56 | 10.09 | 10,705.41 |
| MSCI Europe, Australasia & Far East | -2.13 | -14.29 | -12.92 | 1.44 | 2.48 | 1,936.53 |
| MSCI Emerging Markets | -2.09 | -19.89 | -19.17 | -1.96 | -0.33 | 957.30 |
| Barclays U.S. Aggregate Bond Index | 0.80 | -11.13 | -11.19 | -1.99 | 0.43 |
2,093.05 |
| Merrill Lynch Intermediate Municipal | 0.27 | -6.08 | -6.02 | -0.16 | 1.55 | 300.66 |
As of market close December 16, 2022. Returns in percent.
Strategy & Positioning
— Steve Orr
Wind down
Stock’s 5% swings last week gave traders the volatility they expected. Over $3 trillion in notional options were expiring last Friday. Add central bank rate increases and year-end performance games and you get a price swing roller coaster. A 2% rally in U.S. stocks opened the week. Wednesday’s no-surprise Fed meeting did little damage. Once traders had to square up option books and realized the Fed was raising their inflation outlook, it was time to trim positions. You can judge the net damage in the week-to-date column above, but the S&P 500 is still about 7% ahead and the Aggregate bond index +4% for the quarter.
Next war
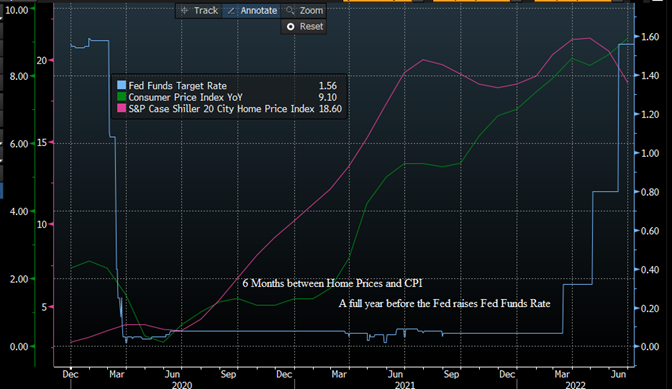
At the beginning of the year, we talked about how the Federal Reserve has a history of reacting too late to inflation cycles. Housing prices are sampled twice per year for the Consumer Price Index. During the 2020 shutdowns, home prices accelerated (pink line below) and the data flowed through to CPI. Three rounds of direct stimulus to consumers from Congress jolted demand higher, and increased strains on already fractured supply chains.
Source: Bloomberg
The Fed finally raised rates for the first time this past March. After six rate increases, the Fed Funds target range sits at 4.25% to 4.5%. Home price gains peaked in February and are falling in some urban areas. These now negative changes will begin showing up in CPI shelters likely in the spring. Bond and stock markets are wrestling with the obvious: the Fed was slow on the uptake — will they be slow to pause or ease now that inflation readings are coming down?
The late, great Marty Zweig coined the phrase “Don’t fight the Fed.” We agree and would like to stand beside the Fed and re-direct their war toward recession. Eleven other central banks are meeting this month, and all appear to be fighting the inflation war. The European Central Bank and Bank of England both raised rates this month and issued concerned statements about inflation. As in the U.S., many of their price components have rolled over and are heading lower. Easing inflation data, order delivery times and shipping prices tell us the inflation war is in the rear-view mirror. On to the recession war.
How deep?
Also heading lower are raw materials prices, factory output, new orders and service activity. All of the forward-looking surveys and indicators we follow are either falling or already in contraction mode. We still think the Fed has as good or better access to data than those of us on Wall Street. We do wonder what they are looking at. If monetary policy (raising interest rates) does take six to 12 months to show up in the economy, then should the Fed keep tightening monetary conditions?
We believe we are at the point where the economy is either going to have a mild slowdown or a full-blown recession. The mild version would be a “rolling recession” where various industries stumble for several quarters and earnings fall only a few percentage points. Maintaining a 16 times price/earnings ratio through most of 2023 would pull the S&P 500 about 8% lower.
A “regular” recession would see multiple quarters of flat to negative growth in the economy and earnings. A drop in earnings of 10% would push S&P 500 earnings into the $200 range for 2023. We have not exited a Bear cycle with price-to-earnings multiples above 16 times. A 15 P/E at $200 works out to be 3,000 or about a 20% drop from today’s levels.
Wrap-up
Mid-term election years average a 19% drop in stock prices prior to election day. Check. Post-election rallies usually bring indices back to nearly flat for the year. Not this year. The fourth quarter should finish in the green for stock and bond prices, but our charts and indicators do not point to any dramatic turn higher just yet.
Essential Economics
— Mark Frears
Home for the holidays
The Christmas trees I mentioned a few weeks ago are appearing in the house. The two main ones in the den take the most time, as each ornament has a story. Passed down from past generations, obtained on a trip, something the boys made, or special memories.

This truly makes the house into a home. How do you look at your abode? Is it an investment, place to lay your head, location that needs constant work, or an oasis to come home to? The housing market is a key industry to watch concerning the inflation-recession discussion.
Rates
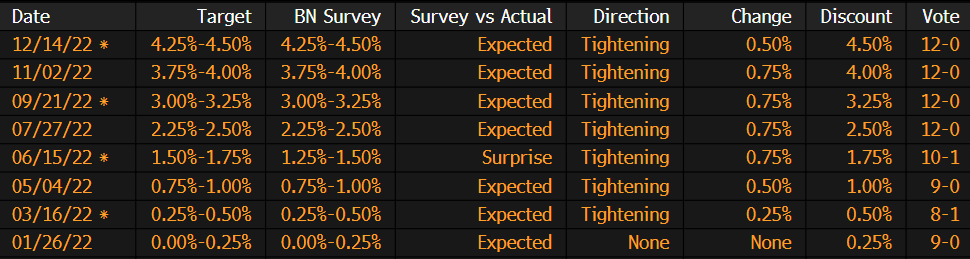
The main headlines you hear about rates concern the Fed and when they are moving the Fed Funds (FF) rate target. This is the rate where banks trade overnight funds, and it is the benchmark the Fed uses to influence the market. The key here is that this is an overnight rate, one day, but the “Fed talk” that accompanies these rate changes influences other rates out the yield curve. So, you have an idea of the magnitude of what the Fed has done so far this cycle. The rate moves are below.
Source: Bloomberg
They started raising rates in March of this year and have increased the FF rate target by 4.25%! That is quite a rate hike and one of the reasons they only moved 50 basis points (bp) this month. There needs to be some time to allow the full impact of the hikes to flow through the economy to see if they are having the desired effect of combating inflation.
The Fed does not have direct impact on the longer end of the yield curve as it reacts to expectations of inflation and/or recession. As the current yield curve is inverted with the 3-month maturity at a higher rate than the 10-year, the market is expecting lower inflation and/or a recession. The crystal ball is still a bit cloudy.
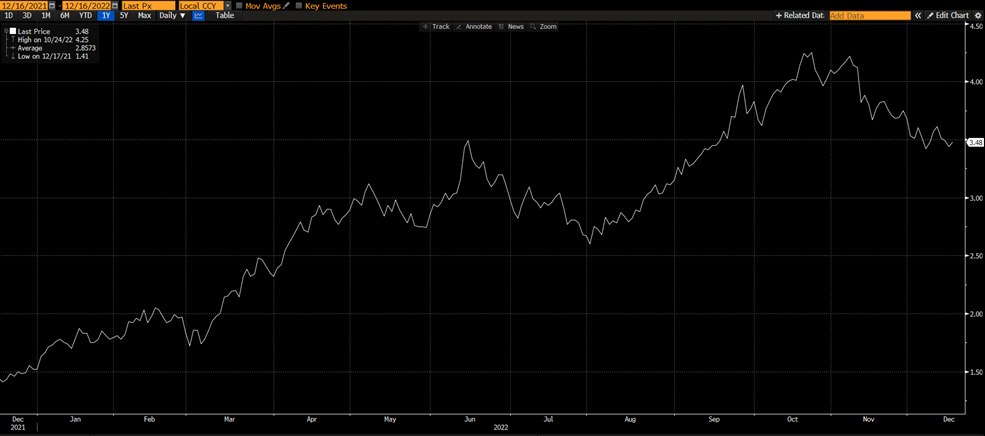
In relation to the housing market, the U.S. Treasury 10-year note is the best proxy for mortgage rates. As you can see below, this rate has been climbing all year and is off the peak of 4.25%, currently hovering around 3.50%.
Source: Bloomberg
Mortgage rates rose to approximately 7% at their peak and have fallen to the low 6% area, for someone with strong credit. This increase in mortgage rates, along with the uncertainty of a possible recession, has caused demand to slow dramatically for purchasing a new residence.
Supply
One of the recent trends in housing that has not changed materially is the lack of supply. Compared to the summer of 2019, pre-pandemic, we are still 700,000 houses below that supply level, as you can see below.
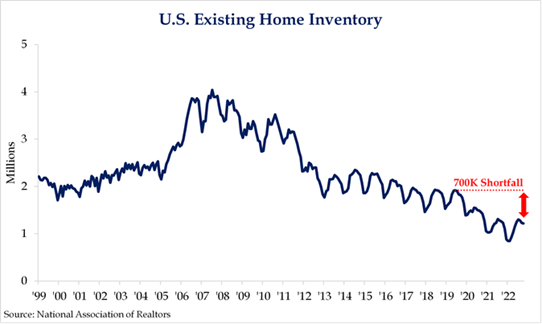
The imbalance between supply and demand helped to cause higher prices. When mortgage rates started to rise, demand slowed, but supply is not changing due to higher labor and material costs. What this tells us is that even when rates drop and economic uncertainty abates, there will still not be enough supply and prices will remain elevated.
While the recent decrease in mortgage rates has helped the buyer, rates and prices are still up dramatically on a year-over-year basis, as the chart below shows.
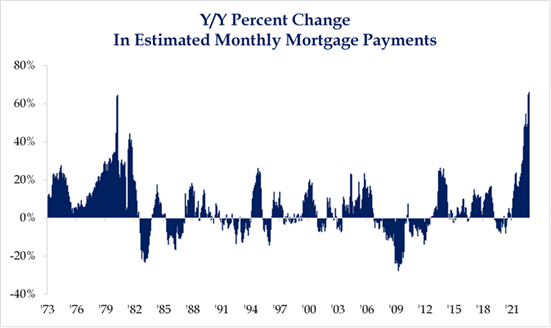
Source: Strategas Research
This will continue to make houses less affordable even as we come out of “the most anticipated recession.”
Economic Impact
It also bears watching the ancillary impacts from this slower market. First, when homes become more expensive, people often turn to remodeling their existing homes. This will have a positive effect on contractors that specialize here, although higher labor and material costs still impact here. Second, other associated businesses like home inspectors, city inspectors and contracted laborers all feel the blow when their hours/contracts slow materially. Third, companies that supply materials will have much less demand for their products, causing stress on their businesses. The housing sector is much broader than homebuilders and the slowing market has shock waves flowing to many areas.
The housing sector is one of the quickest areas to react to higher interest rates, so we will be watching closely to see how long this impact holds and we start to see improvement here, either on the supply or demand side.
What to watch
In the coming week we will have many housings sector releases. National Association of Home Builders Index, Building Permits, Housing Starts, Mortgage Applications, Existing Home Sales, and New Home Sales. The expected metrics can be found in the table below. While we are not expecting to see a turnaround yet, these are indicators to keep an eye on as the economic cycle progresses.
Wrap-up
As your abode is most likely your highest expense, it will pay dividends to keep an eye on the trends in this sector. For now, we are going to turn on the gas fireplace and enjoy the Christmas season in our home. Hope you are doing the same!
| Upcoming Economic Releases: | Period | Expected | Previous | |
|---|---|---|---|---|
| 19-Dec | NAHB Housing Market Index | Dec | 34 | 33 |
| 20-Dec | Building Permits | Nov | 1,480,000 | 1,526,000 |
| 20-Dec | Building Permits MoM | Nov | -2.1% | -2.4% |
| 20-Dec | Housing Starts | Nov | 1,400,000 | 1,425,000 |
| 20-Dec | Housing Starts MoM | Nov | -1.8% | -4.2% |
| 21-Dec | Existing Home Sales | Nov | 4,200,000 | 4,430,000 |
| 21-Dec | Existing Home Sales MoM | Nov | -5.2% | -5.9% |
| 21-Dec | Conference Bd Consumer Confidence | Dec | 101.0 | 100.2 |
| 21-Dec | Conference Bd Present Situation | Dec | N/A | 137.4 |
| 21-Dec | Conference Bd Expectations | Dec | N/A | 75.4 |
| 22-Dec | Chicago Fed Nat Activity Index | Nov | N/A | (0.05) |
| 22-Dec | GDP Annualized QoQ | Q3 | 2.9% | 2.9% |
| 22-Dec | Personal Consumption | Q3 | 1.7% | 1.7% |
| 22-Dec | GDP Price Index | Q3 | 4.3% | 4.3% |
| 22-Dec | Initial Jobless Claims | 17-Dec | 222,000 | 211,000 |
| 22-Dec | Continuing Claims | 10-Dec | 1,685,000 | 1,671,000 |
| 22-Dec | Leading Index | Nov | -0.5% | -0.8% |
| 22-Dec | Kansas City Fed Manuf Activity | Dec | (6) | (6) |
| 23-Dec | Personal Income | Nov | 0.3% | 0.7% |
| 23-Dec | Personal Spending | Nov | 0.2% | 0.8% |
| 23-Dec | Real Personal Spending | Nov | 0.1% | 0.5% |
| 23-Dec | Durable Goods Orders | Nov | -1.0% | 1.1% |
| 23-Dec | Durable Goods Orders ex Transport | Nov | 0.0% | 0.5% |
| 23-Dec | Cap Gds Orders Nondefense ex Air | Nov | 0.2% | 0.6% |
| 23-Dec | PCE Deflator YoY | Nov | 5.5% | 6.0% |
| 23-Dec | PCE Core Deflator YoY | Nov | 4.7% | 5.0% |
| 23-Dec | UM (Go MSU) Consumer Sentiment | Dec | 59.1 | 59.1 |
| 23-Dec | UM (Go MSU) Current Conditions | Dec | N/A | 60.2 |
| 23-Dec | UM (Go MSU) Expectations | Dec | N/A | 58.4 |
| 23-Dec | UM (Go MSU) 1-yr inflation | Dec | 4.6% | 4.6% |
| 23-Dec | UM (Go MSU) 5- to 10-yr inflation | Dec | 3.0% | 3.0% |
| 23-Dec | New Home Sales | Nov | 600,000 | 632,000 |
| 23-Dec | New Home Sales MoM | Nov | -5.1% | 7.5% |
Steve Orr is the Executive Vice President and Chief Investment Officer for Texas Capital Bank Private Wealth Advisors. Steve has earned the right to use the Chartered Financial Analyst and Chartered Market Technician designations. He holds a Bachelor of Arts in Economics from The University of Texas at Austin, a Master of Business Administration in Finance from Texas State University, and a Juris Doctor in Securities from St. Mary’s University School of Law. Follow him on Twitter here.
Mark Frears is an Investment Advisor, Executive Vice President, at Texas Capital Bank Private Wealth Advisors. He holds a Bachelor of Science from The University of Washington, and an MBA from University of Texas – Dallas.
The contents of this article are subject to the terms and conditions available here.