Getting ready – for more market excitement — Week of August 19, 2024

| index | wtd | ytd | 1-year | 3-year | 5-year | index level |
|---|---|---|---|---|---|---|
| S&P 500 Index | 3.99 | 17.47 | 28.95 | 9.36 | 15.80 | 5,554.25 |
| Dow Jones Industrial Average | 3.02 | 9.15 | 20.31 | 6.95 | 11.73 | 40,659.76 |
| Russell 2000 Small Cap | 2.98 | 6.55 | 17.47 | 0.85 | 8.90 | 2,149.94 |
| NASDAQ Composite | 5.35 | 18.00 | 33.46 | 7.24 | 18.42 | 17,631.72 |
| MSCI Europe, Australasia & Far East | 4.09 | 8.79 | 18.54 | 3.80 | 8.89 | 2,374.84 |
| MSCI Emerging Markets | 2.91 | 9.09 | 15.55 | -1.56 | 5.31 | 1,093.65 |
| Barclays U.S. Aggregate Bond Index | 0.53 | 2.91 | 8.67 | -2.13 | -0.01 | 2,224.83 |
| Merrill Lynch Intermediate Municipal | 0.14 | 0.83 | 4.92 | -0.39 | 0.96 | 317.49 |
As of market close August 16, 2024. Returns in percent.
Investment Insights
— Steve Orr
Get hopping
Two weeks removed from the Monday Massacre on August 5, news outlets would have you believe all is well. From that Monday, the S&P 500 rose in seven of nine trading days. The NASDAQ and Russell 2000 Small Cap indices followed similar patterns. All three vaulted back above their 50-day moving averages last Thursday. The financial press made much of that 1% to 2% move by the various indices, ascribing the price action to a lower jobless claims reading. The thinking was that the weak July jobs report was not being confirmed by additional layoffs. The full week’s returns of 2.5% to 5% for the various indices had some investors thinking “all clear” from late July’s quick drop.
That is an easy explanation but is not the story. Looking through our dusty archives, we cannot find a market reaction anywhere close to a 1% rally or drop attributed to jobless claims. Jobless claim data is compiled weekly by the states, submitted to D.C. and then issued on Thursdays. It is a charter member of the “secondary cheap seats” economic indicators club. Jobless claims have some warning power of changing payroll numbers but are more useful as a coincident indicator of recession. At any rate, jobless claims drifting between 215,000 and 250,000 are an indicator of an economy in second gear, not a glorious 4% GDP growth that would justify a 2.5% runup in the Russell 2000.
Get real
A more reasonable explanation is that once hedge players and trend following strategies shook off the “drop dirt” of the July/early August air pocket, they realized that Yen funding costs rising from zero to just one quarter of a percent was not all bad. Result: piling back into carry trades. The favorite, even more than long tech, short small cap, has been owning Mexican government bonds, paying up to 10%. Traders piling back into carry trades make the charts look like counter trend rallies rather than “all clear” action.
Another explanation is more grease for the financial gears. In the age of “abundant reserves,” where the Fed maintains a much larger balance sheet than necessary, money sloshes between the U.S. Treasury’s checking account (Treasury General Account), the Fed’s balance sheet and its Reverse Repurchase Program for money market funds. From the end of July through last week, more than $230 billion came out of the TGA and Reverse Repo. All that money went somewhere, and much of it appeared to end up in large cap stocks.
Get expensive
Funds flowing into stocks pushes prices. Earnings generally follow price in the business cycle. Valuations for stocks are in the “pricey” range. Price to earnings ratios (P/E) for next year’s earnings are in the 21 times range, well above the five-year average of 19x. The equity risk premium is the inverse of P/E minus the 10-year Treasury rate. This difference suggests whether stocks are rich to bonds over time. As interest rates rose over the past couple of years, stocks had a higher return hurdle to jump over. When the ERP is above the pink line, stocks are relatively cheap to bonds. The ERP suggests stocks are as expensive as they have been relative to bonds since the GFC in 2008-09.
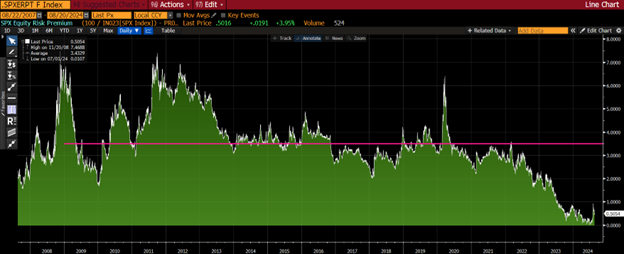
Source: Bloomberg, LP
High valuations combined with seasonal volatility is a recipe for patience, if not risk control. We do not aspire to be forecasters, unless we are asked about the Dallas Cowboys. Over the past 70 years, returns for stocks in September average a drop of 1%. This performance ranks September dead last in the rankings. Hey, somebody has to be the caboose.
Get more
If earnings follow price, then what is the outlook for the big index? For the second quarter, 93% of the S&P 500 members have reported. FactSet reports the group’s earnings rose an average of 10.9% over last year’s second quarter. That is not far out of line with this year’s +18% return of the index. Overall it was a good quarter; earnings growth broadened across sectors. Financials, utilities, materials and healthcare exceeded expectations.
Looking ahead to the third quarter season that ramps up in mid-October, analysts have lowered their estimate of S&P 500 earnings from around 7% to 4.4%. Every sector has lower estimates than the end of July. Strategas reports that Energy sector earnings could be 14% lower than last year’s third quarter.
This is week two of retail reports: Lowe’s, Target, TJ Maxx, Ross and Dollar Tree are on the clock. Most traders are antsy for NVIDIA’s report on August 28. We expect market volatility to pick back up around that release.
Get down
Over in interest rate land, the bond market is doing the Fed’s work for it. Powell should be sending thank-you notes to the 10-year Treasury on a monthly basis. Since late April, 10 years have fallen just over 0.8%, from 4.7% to 3.88%. For longer-term borrowers, this amounts to at least a half of a percent rate cut. Lower mortgage rates are one result. Already we are seeing a spike in mortgage refinancing, and our desk is happily punching tickets for grateful borrowers.
The difference between the Fed’s overnight borrowing rate of 5.25% and the 10-year Treasury is now at a 30-year high. Previous highs in this spread were in the Y2K runup and just prior to the 2008 GFC.
Also getting down, though slowly, is the BLS’s consumer price index. The July reading of 2.9% is the slowest increase in prices since March of 2021. Over the past three months, annual inflation is running at a 1.6% growth rate. That should cheer Fed members and traders who demand rate cuts start in September. We would remind our readers that food and shelter prices are, at a minimum, 40% higher than 2019 levels. That is quite a shock after 20 years of 2.2% inflation.
Traders are betting that this coming Friday morning, Chairman Powell will lay out a rate cutting path for the next couple of years. Here’s betting he only says the Fed will remain data-dependent.
Wrap-Up
Last week’s “In the eye” missive covered points that suggest we are in the middle calm period of an increased volatility cycle. Today we looked at valuation and market conditions that suggest more chop ahead.
We maintain our stance that the Fed likely will cut in September in a bow to Wall Street. The economy would benefit financially and psychologically if it were a half of a percent cut after the election. Look for clues in Powell’s speech this coming Friday.
Steve Orr is the Managing Director and Chief Investment Officer for Texas Capital Bank Private Wealth Advisors. Steve has earned the right to use the Chartered Financial Analyst and Chartered Market Technician designations. He holds a Bachelor of Arts in Economics from The University of Texas at Austin, a Master of Business Administration in Finance from Texas State University, and a Juris Doctor in Securities from St. Mary’s University School of Law. Follow him on Twitter here.
The contents of this article are subject to the terms and conditions available here.
Texas Capital Private Bank™ refers to the wealth management services offered by the bank and non-bank entities comprising the Texas Capital brand, including Texas Capital Bank Private Wealth Advisors (PWA). Nothing herein is intended to constitute an offer to sell or buy, or a solicitation of an offer to sell or buy securities.
Investing is subject to a high degree of investment risk, including the possible loss of the entire amount of an investment. You should carefully read and review all information provided by PWA, including PWA’s Form ADV, Part 2A brochure and all supplements thereto, before making an investment.
Neither PWA, the Bank nor any of their respective employees provides tax or legal advice. Nothing contained on this website (including any attachments) is intended as tax or legal advice for any recipient, nor should it be relied on as such. Taxpayers should seek advice based on the taxpayer’s particular circumstances from an independent tax advisor or legal counsel. The wealth strategy team at PWA can work with your attorney to facilitate the desired structure of your estate plan. The information contained on this website is not a complete summary or statement of all available data necessary for making an investment decision, and does not constitute a recommendation. The information has been obtained from sources considered to be reliable, but we do not guarantee that the foregoing material is accurate or complete. Any opinions are those of the authors and not necessarily those of PWA or the Bank.
©2025 Texas Capital Bank Wealth Management Services, Inc., a wholly owned subsidiary of Texas Capital Bank. All rights reserved.
Texas Capital Bank Private Wealth Advisors and the Texas Capital Bank Private Wealth Advisors logo are trademarks of Texas Capital Bancshares, Inc., and Texas Capital Bank.
www.texascapitalbank.com Member FDIC NASDAQ®: TCBI