Markets stuck in the chop — Week of September 18, 2023

| index | wtd | ytd | 1-year | 3-year | 5-year | index level |
|---|---|---|---|---|---|---|
| S&P 500 Index | -0.12 | 17.29 | 15.99 | 11.08 | 10.78 | 4,450.32 |
| Dow Jones Industrial Average | 0.14 | 6.14 | 14.24 | 9.52 | 8.08 | 34,618.24 |
| Russell 2000 Small Cap | -0.20 | 5.98 | 2.74 | 7.63 | 2.76 | 1,847.03 |
| NASDAQ Composite | -0.37 | 31.79 | 19.74 | 7.86 | 12.36 | 13,708.33 |
| MSCI Europe, Australasia & Far East | 1.26 | 11.00 | 20.26 | 6.43 | 4.90 | 2,099.61 |
| MSCI Emerging Markets | 0.97 | 5.15 | 5.60 | -1.29 | 1.90 | 982.11 |
| Barclays U.S. Aggregate Bond Index | -0.09 | 0.50 | -0.29 | -4.73 | 0.43 | 2,059.00 |
| Merrill Lynch Intermediate Municipal | -0.10 | 0.85 | 2.36 | -1.19 | 1.64 | 301.35 |
As of market close September 15, 2023. Returns in percent.
Investment Insights
— Steve Orr
Stuck
If September is supposed to be cooling from hot weather, then perhaps it is also a time for stocks to cool from a hot summer rally. Almost every index, save Dow Transports and Small Cap, has drifted into neutral and is stuck there. Emerging Markets finally caught a break last week after several small stimulus efforts by the Chinese government helped stabilize their securities markets. Last Friday’s drops of -1% to -3% in various stock indices were more about closing a record $4 trillion in options positions than starting a new trend.
The S&P 500 is a good example. Yes, options expiration games took the index below its (pink) 50-day moving average. Pulling our microscope back to the summer, the horizontal white line shows support in the 4,450 area. The big index made two runs at 4,450 back in June before finally breaking out in July. After a fling with 4,600, it has traded back down to support at 4,450 (white line). This month’s action has been confined to 4,500 as overhead resistance and, like last Friday’s action, 4,450 for support.
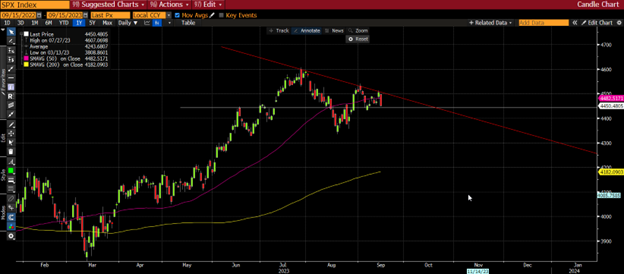
Source: Bloomberg, L.P.
As perpetual Worrying Bulls, we do wonder about that red trend line. Clearly the July breakout did not appear to have legs. Actually, it did quite well and a return to resistance or “throwback” is normal. History tells us the week after September option expiration is usually weak. Eric Johnston at Cantor verified this rule of thumb. His staff found that the S&P 500 fell 27 of the last 35 years this week. The average drop was around -1% and nine were greater that -2%. Cue the choppiness we have been warning about.
Same song
Speaking of Bulls, Wall Street’s eternal optimists told us last week that, really this time, the Fed is almost done. “Maybe a slight chance of one more rate increase in November or December and then that’s it. We mean it.” Or something like that. We live in Realville, where our wins and losses show up at the bottom of our investment statement. Color us cautious on the “one more and done” idea.
The Fed’s stated goal in raising interest rates is to bring down inflation to 2%. Wall Street has embraced this goal and for the last two and a half years has predicted that within two years we would be back at 2%. No dice. For those keeping score, the Fed spent most of the last decade trying to get inflation up to 2%. After global shutdowns, reordering of global supply chains, a new regional war in Europe, and accelerating retirements from baby boomers, one would think the Fed and Wall Street would change their tune.
Still growing
Last week’s August Consumer and Producer Price index releases suggest the Fed is making progress. Consumer prices rose 3.7% year-over-year and Producer prices a scant 1.6%. The CPI figure certainly fits with most of the data that suggests the 4% area is where inflation will settle out in the coming months. The sub-2% number registered by PPI is more a function of falling demand for industrial commodities and slowing production than dramatic price changes.
The headline CPI number is influenced by gasoline price changes, so as you watch the prices on the freeway you can get a feel for next month’s report. Rent and home prices make up 30% of the monthly reading. So how did shelter drop last month? Well, it’s what you do not see that can hurt. The BLS includes hotels in this category. Hotel prices supposedly dropped -3.6% last month. Why would hotel prices drop during summer travel season? Odd.
Another unusual item last month was auto insurance, which rose 19% over a year ago in August. Used and new car prices have been moderating during the summer, contributing to that 3% bottom back in June. The rolling strikes started by the UAW last week may start affecting inventories in several weeks if they continue this “intermittent” approach. As an aside, UAW strike fund has about 30 days of funding at full walkout. Both used and new car price trends could reverse higher if the strike rolls from days into weeks.
Another surprise inflation coming to a wallet near you: medical inflation. In October the Administration is set to release revisions to the health insurance measures in the CPI calculations. Medical costs for the CPI are inferred from health insurer profits. These changes will feed into the CPI starting in November, adding 0.1% to 0.3%.
Over the last 40 years, price increases as measured by CPI have been above this level less than 5% of the time. Each time was associated with rising federal debt and deficit spending. Finally we would note that inflation comes in waves, and the ripples from last year’s run to 9% have yet to start. The Fed learned a tough lesson in the early 1980s, cutting rates after the first wave, thinking that inflation had been tamed.
Wrap-Up
Traveling sideways in stocks and bonds does not mean no price changes, just that daily price swings are bounded in a narrow range. The longer-term uptrend for stock prices and interest rates remains in place.
Inflation rates capture the headlines and 3% to 4% does not sound too threatening. Most prices are 30% to 50% above 2019 levels. Rents are 40% higher in most cities and are not going back. This is the issue: when is the economic, wage and asset growth to catch up?
Steve Orr is the Managing Director and Chief Investment Officer for Texas Capital Bank Private Wealth Advisors. Steve has earned the right to use the Chartered Financial Analyst and Chartered Market Technician designations. He holds a Bachelor of Arts in Economics from The University of Texas at Austin, a Master of Business Administration in Finance from Texas State University, and a Juris Doctor in Securities from St. Mary’s University School of Law. Follow him on Twitter here.
The contents of this article are subject to the terms and conditions available here.