Higher rates regardless — Week of September 4, 2023

| index | wtd | ytd | 1-year | 3-year | 5-year | index level |
|---|---|---|---|---|---|---|
| S&P 500 Index | 2.55 | 18.93 | 15.76 | 10.29 | 11.13 | 4,515.77 |
| Dow Jones Industrial Average | 1.57 | 6.73 | 12.45 | 8.93 | 8.37 | 34,837.71 |
| Russell 2000 Small Cap | 3.67 | 10.14 | 7.00 | 8.10 | 3.33 | 1,920.83 |
| NASDAQ Composite | 3.27 | 34.86 | 20.15 | 6.39 | 12.61 | 14,031.81 |
| MSCI Europe, Australasia & Far East | 2.78 | 11.40 | 21.87 | 6.80 | 4.74 | 2,109.16 |
| MSCI Emerging Markets | 0.96 | 4.80 | 3.49 | -1.60 | 1.32 | 980.33 |
| Barclays U.S. Aggregate Bond Index | 0.95 | 1.37 | -0.60 | -4.47 | 0.49 | 2,076.79 |
| Merrill Lynch Intermediate Municipal | 0.35 | 1.24 | 2.13 | -1.05 | 1.64 | 302.52 |
As of market close September 1, 2023. Returns in percent.
Investment Insights
— Steve Orr
One Down
The calendar says we are two-thirds of the way done with the third quarter. Traders know we are just halfway through the third-quarter performance slog. August’s long-term average is a loss of 0.8%. This year’s edition posted a loss of 1.6%, dragged down by good US economic data and bad China economic data. Good and bad? Several strong July data points in the US-fueled fears of more Fed rate increases. China’s non-recovery from shutdowns and increasing real estate woes are pulling down emerging markets’ stocks. September, with its shutdown drama and breathless cable news, awaits.
The performance table above shows most other stock indices fared worse than the big 500 index in August. This year’s outlier continues to be the big tech NASDAQ 100. Its Artificial Intelligence meme-fueled run closed August at 42.5% year-to-date. Take out the top seven tech names from the S&P 500, and the returns of the rest of the 493 are flat to down. Talk about a recovery. Those 493 names drifting lower mimic the slowly sliding consumer confidence numbers that came out last Tuesday. The Conference Board’s monthly measure of consumers’ attitudes and expectations hit a high in October of 2018. The index fell by the most in two years thanks to food inflation, higher borrowing costs and increasing concerns over job security.
Slow ride
Higher borrowing costs are a recurring theme in every sector of the economy. We have written before about the rising interest costs for the Federal government and corporate America. Mortgage rates are now their highest in over a decade, squelching a housing recovery from pandemic shutdowns. New and used car loan rates are beginning to crimp sales. Where is a reasonable range for interest rates to go?
We think the current grind higher in long-term Treasury rates has another three quarters of a percent or one percent left in the tank. That is not great news for bonds or stocks. In the near term, bonds may suffer some price erosion, but nowhere near the levels of the last two years. Stocks already have a worthy competitor in cash, paying north of 5%. Ponder the oft-quoted “long-term return of 9%” in stocks. At 5.25%, one can earn over half of the return of stocks with little to no price risk. If our logic is correct (be suspicious), then 10-year Treasury rates trading today at 4.17% should reach 5% to 5.25% over the next year.
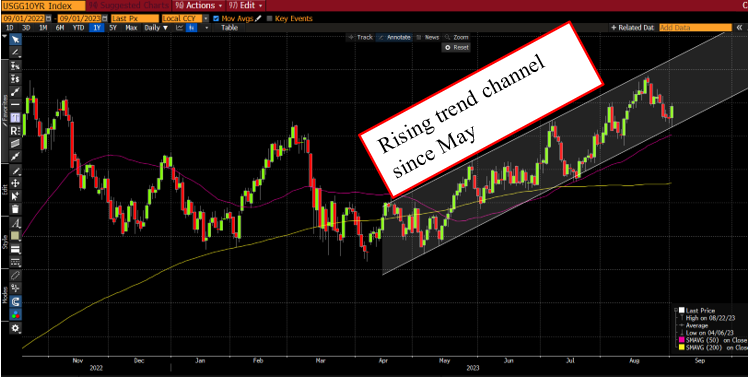
Source: Bloomberg, L.P.
Support for higher rates comes from several sources. Government borrowing is not going away. As we enter the final month of the fiscal year, the federal deficit is north of $1.6 trillion. Spending in excess of tax revenue (or income) is a form of leverage. That extra money being created and pushed into the economy creates activity and, in some cases, bubbles, that otherwise would not exist. This and next year’s culprit is the misnamed Inflation Protection Act, which will dribble out spending to infrastructure, manufacturing plants and wind farms in an election year to keep economic activity up.
Inflation is not returning to its pre-pandemic levels. We would like the Wall Street crowd to be correct and have 2% or lower inflation a year from now. Not going to happen. PCE Core inflation is running at a 4.2% rate. The Cleveland Fed’s CPI nowcast series bottomed at 3.22% in June. It is trending at 3.82% today, suggesting August’s consumer price index reading will be nearing 4% again. The global workforce north of the equator is aging, and surprisingly less productive. One would assume computers and internet would be productivity enhancers. US productivity output per hour peaked at the beginning of the century and at best has been flat the last couple of years.
Global trade tends to run in 50- to 70-year cycles. For most of our readers, Bretton Woods ushered in a post-World War II global trade explosion that has driven down production and labor costs. The end of the Soviet Union Cold War marked the beginning of the end of that cycle. A newly expansionist China in turn has created a new Cold War and hastened the end of that prior global trade cycle. The reshoring movement has increased demands for materials, new shipping routes and labor.
Shutdowns and reshoring stirred private unions to muscle larger concessions out of their employers. Public sector unions have jumped in, too. Our current list of 2023 negotiations, strikes and strikes-to-be: Los Angeles teachers, American Airlines attendants, Southwest pilots, UPS Teamsters, West Coast longshoremen, Writers Guild of America, SAG-AFTRA, Oakland teachers, Big 3 automakers. UPS and the automakers are concerning because those union jobs are thought to be career positions, not just a step on one’s career ladder. Wage pressures are a big part of the Fed’s inflation calculations.
De-commit
The Fed remains committed to reaching its goal of 2% inflation. We wonder why the Fed is so committed to a pre-2019 goal, when the world has clearly changed. The “natural level” of inflation when interest rates were zero or negative was around 1%, consistent with money supply growth. Fed speakers admitted five years ago that they had no ability to calculate the correct level of inflation. We would respectfully ask the Fed to inflate its goal to 3% or even higher. Fewer workers having more negotiating leverage and higher prices for fuel and raw materials mean a new inflation cycle is underway. “What is that, you say? ‘An inflation cycle when last year CPI rose 9% and now is only 3.5%?’” Yes, inflation always spikes up and down. The key in a cycle or trend is watching the lows. When each low is higher than the last, an uptrend is underway. This is the trend of inflation over the next decade.
Half again
Quarterly GDP growth has three estimates released in the following quarter: advance, second and third. The aptly named releases each paint a more precise picture as more complete data comes in. The “final final” numbers can take much longer as seasonal revisions and revised data become available. The second release for second quarter GDP showed a drop from 2.4% growth to 2.1%. Household spending rose at a 1.7% pace, but the headline number was pulled lower by less business investment and inventories than first estimated.
Friday’s August non-farm payrolls showed continued strength, coming in above estimates at 187,000 net new jobs. We would caution readers that every job release this year has been revised lower in the following two months. June’s release of 209,000 now sits at 105,000. The job openings survey continues to fall, now down to 8.8 million openings. Wall Street liked both numbers, and initially bid up shares. Why does the Street like falling growth? The simple logic is that a slight rise in unemployment and falling job numbers mean the Fed will not have to keep raising interest rates to rein in the economy. And everybody likes lower interest rates.
The pre-holiday Friday action meant traders got out early and stocks barely finished the first day of the month in the green. As we invest for the intermediate and long term, we would point out that economic and job growth are both running at half of last year’s rate, which was half of 2021’s rate. The post-shutdown bounce is fading.
Wrap-Up
Bumpy August brings choppy September. June and July economic data was fairly strong. August appears to be a step down, not too hot, not too cold. The yield curve still forecasts a recession in the next couple of months.
We are encouraged by Wall Street earnings estimates for the third quarter and 2024 increasing modestly. Purchasing Manager indices are released this Wednesday. If Purchasing Manager indices start to rise into expansion territory over the next several months, our stock indicators would improve above neutral, suggesting better markets late this year. Beyond this year, intermediate and long-term trends for stocks are still higher.
Steve Orr is the Executive Vice President and Chief Investment Officer for Texas Capital Bank Private Wealth Advisors. Steve has earned the right to use the Chartered Financial Analyst and Chartered Market Technician designations. He holds a Bachelor of Arts in Economics from The University of Texas at Austin, a Master of Business Administration in Finance from Texas State University, and a Juris Doctor in Securities from St. Mary’s University School of Law. Follow him on Twitter here.
The contents of this article are subject to the terms and conditions available here.