Job growth = no recession now — Week of August 8, 2022

Strategy and Positioning written by Steve Orr, Chief Investment Officer; and Essential Economics written by Mark Frears, Investment Advisor
| index | wtd | ytd | 1-year | 3-year | 5-year | index level |
|---|---|---|---|---|---|---|
| S&P 500 Index | 0.39 | -12.25 | -5.03 | 14.75 | 12.82 | 4,145.19 |
| Dow Jones Industrial Average | -0.11 | -8.71 | -4.60 | 10.33 | 10.61 | 32,803.47 |
| Russell 2000 Small Cap | 1.96 | -13.79 | -13.05 | 9.88 | 7.69 | 1,921.82 |
| NASDAQ Composite | 2.18 | -18.72 | -14.37 | 18.37 | 15.88 | 12,657.55 |
| MSCI Europe, Australasia & Far East | 0.26 | -14.96 | -14.95 | 5.26 | 3.13 | 1,941.71 |
| MSCI Emerging Markets | 0.13 | -17.57 | -21.11 | 3.43 | 1.28 | 994.59 |
| Barclays U.S. Aggregate Bond Index | 0.03 | -8.13 | -9.11 | -0.62 | 1.25 | 2,163.70 |
| Merrill Lynch Intermediate Municipal | 0.26 | -5.12 | -5.63 | 0.30 | 1.78 | 303.73 |
As of market close August 5, 2022. Returns in percent.
Strategy & Positioning
— Steve Orr
Now what?
A dull week with declining volatility is typical for August. We did not think markets would quiet down so quickly, especially with the big jobs number last Friday. Earnings continued to do well, with few surprises. Volume is trailing off; rates are sliding into trading ranges. It almost feels like a typical August. Until one tries to paint a consistent picture of the economy and market action.
Blowout
Mark will go into the jobs report in more detail. For markets the short answer is that 528,000 new jobs and unemployment dipping another tenth to 3.5% means the economy is still growing. Business surveys and commodity prices suggest supply chains and producer prices are improving. At the same time, new orders and other sales indicators show slowing activity. Jobless claims are rising week-over-week and layoff announcements are rising. All of the above paints a confusing picture. One unappealing aspect of job growth is the rising number of side gigs. Uber’s CEO was on tape last week stating that a large percentage of their new drivers were coming onboard because of inflation. One job for living, one for gas and food?
The blowout jobs number gives the bears justification for more Fed rate increases. We wonder about the difference between the non-farm payroll and household surveys. The unemployment rate is calculated from the household survey. July’s NFP is +528k while the change in jobs in the Household is -63k. Total household jobs over the last six months is 273,000. That looks more like a stagnating economy.
The Fed is determined to slow inflation and willing to risk recession to do it. Watch what they do, not what they say in speeches. There will be another jobs report and two consumer price releases before the next Fed meeting September 20 – 21. Wednesday’s CPI report for July is supposed to fall below 9%. Anything above 9% will likely pressure short-term rates higher. Ten-year Treasury rates are stuck in a trading range of 2.5% to 3.2%. If inflation magically falls below 7%, markets will shift toward a quarter-point increase and yields fall toward 2.5%. Two more CPI prints 9% or above and watch markets demand three-quarters or even a 1% increase. Yields push higher to 3.5% and bond losses increase. Our bond indicators are largely neutral at present, but we are maintaining below market exposure in duration.
What else?
Anything else inflating that analysts expected to go down? The second quarter earnings season is almost complete. Positive surprises have risen every week, contrary to expectations. A pleasant surprise for sure, but the number of surprises and their levels are still below their five-year averages. This fits with the slowdown narrative we have presented throughout 2022: slowing growth in all areas of the economy as shutdown stimulus wore off. War, inflation and a late Fed have accelerated the slowdown and stoked recession fears.
FactSet reports that, on a year-over-year basis, the S&P 500 is reporting its slowest earnings growth since the fourth quarter of 2020. Fully 87% of the index’s members have reported through last Friday. Three-quarters have beat earnings estimates, by an average of 3.4%. This contrasts with the five-year averages of 77% beats by an average amount of 8.8%. Lots of numbers but the bottom line is this: most Wall Street analysts thought the second quarter would have earnings growth of 4% back at the end of June. Thanks to the energy and healthcare sectors, final earnings growth for the quarter may reach 6.7%.
Financials, Consumer Discretionary and Communication Services (internet stocks) bring up the rear. All had negative growth. Financials – the big banks – struggled with rising rates and slowing deal flow. Discretionary from consumers cutting back on big ticket items like cars (there are none) and, of course, folks going back to work hurt streaming services.
Analyst consensus today says third quarter earnings should grow 5.8% and fourth quarter 6%. For all of 2022, consensus rides at 8.9% growth. We would be happy to see nearly 9% growth in S&P 500 earnings this year. The good results this year have come from margins. Companies have largely been able to pass along cost increases, riding inflation to higher earnings. We doubt margins can stay at record levels.
Earnings per share times the P/E multiple equals the index value. Earnings of $234.61 per share for the S&P 500 at Friday’s close of 4,145 produces a forward P/E of 17.6x. Not bad, not grab-it cheap but not bad. For perspective, given the nosebleed valuations of the last few years, a 17.6 P/E is just above average for the last 10 years. This is consistent with our stock indicators, which are still slightly negative on valuation, neutral on trend and show negative sentiment.
Wrap-up
August is generally a flat month and last week held true to form. July’s payroll growth grabbed the headline. Workforce growth and the household survey are growing but not as strong. Stocks have already dropped and had their countertrend rally. <i>Bear cycles do not end before recessions start.</i> We find ourselves in no-man's (“trader's?”) land, without a cohesive picture of the economy and markets.
If the recession has started, then stocks have another leg lower to go in the fall. Strong job growth says we are not yet in recession. Can we rally our way out with higher earnings in the fall? We assign a low probability to a jump in corporate earnings when the Fed is committed to raising rates. Staying neutral to cautious for now.
Essential Economics
— Mark Frears
Different or the same?
It is amazing how two kids can grow up in the same family and be totally different. My brother was the outgoing athlete, and I was the introverted bookworm. My oldest son takes after me and my youngest is more like my brother. Same house, same parents, same schools, two very different people. The markets are trying to figure out if the current economic picture is different or retelling the same story.
Recession
If you follow the pure definition, we have had, or are in, a recession. Two consecutive quarters of negative economic growth (Gross Domestic Product (GDP)) are on the books. First and second quarters of this year did not make it above zero. What do you think? Has your behavior changed? Your spending habits? Has the behavior of people in your city/region changed? As we are in Texas, a business-friendly environment, we are not seeing a lot of change. So, instead of listening to the media talking heads, let’s look at recent economic releases.
Manufacturing
Last week we saw the S&P Global Manufacturing releases for July. The overall number at 52.2 is still above 50, showing an expanding sector, but just barely. The Services component is showing contraction at 47.3. So, we are right on the cusp here. The Institute of Supply Management (ISM) Manufacturing numbers also came out this week. It was also above 50 for July, at 52.8, while the Services component was stronger at 56.7.
The Global Purchasing Managers Index (PMI) slipped to 51.1 in July, the lowest level since July 2020. New orders and export orders also slowed. The only pickup was for inventories, and that is not a positive as it indicates slowing demand. While price pressures are easing due to fewer supply chain issues, they remain at elevated levels.
Heigh-ho, heigh-ho
The headline item for the week was the Nonfarm Payroll release on Friday. Before we get to that, weekly Jobless Claims continue to rise, indicating more people are out of work.
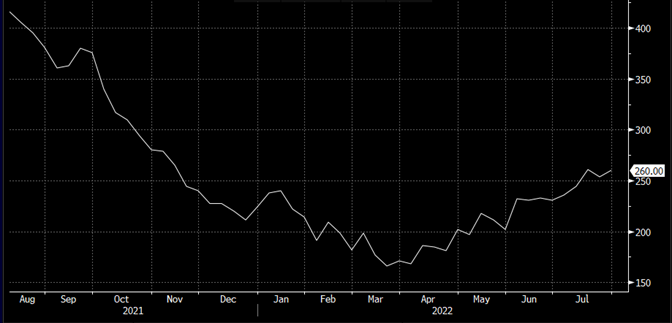
Source: Bloomberg
This is a common feature of late cycle economic slowdown. Continuing Claims are on the rise also.
So, you would think we would see fewer jobs added in the monthly Nonfarm Payroll release for July. Not so fast, my friend. Expectations were for 250,000 jobs to be added and the actual number was 528,000! Well above estimates and hardly consistent with a slowing economy. The other headline was that this addition to the workforce brought the number of jobs back up to pre-pandemic levels. While this is true from an actual number of people, the participation rate has not caught up. As a percentage of the working age population, we are only at 62.1%, falling recently and not close to pre-pandemic 63.4%. Where are all the people? The Job Openings and Labor Turnover Survey (JOLTS) shows 10.7 million job openings!
What do you make of this job market? Even though prices have increased, wages are still rising. These increases are not enough to keep up with 8 or 9% inflation. There is a disparity of news from companies. While Walmart is laying off people, Uber is seeing an increase. You cannot have an economic slowdown when jobs are still plentiful, and wages are strong. The FOMC can only work on slowing demand and they will have to keep raising rates if the labor market continues this performance.
To add a counterpoint, we are seeing the unemployment rate stay at a very low 3.5%, which comes from the Household survey. There is not a small inconsistency in these two measures of employment. The Household survey shows a net add of 273,000 jobs over the last six months, while the nonfarm survey shows a gain of over 2,000,000 jobs. Which number do you believe?
Bond, UST Bond
Fixed Income markets reflect expectations of upcoming economic activity in the rates along the yield curve. The short end, out to two years, is showing expectations of FOMC activity and the longer end reflects inflation expectations.
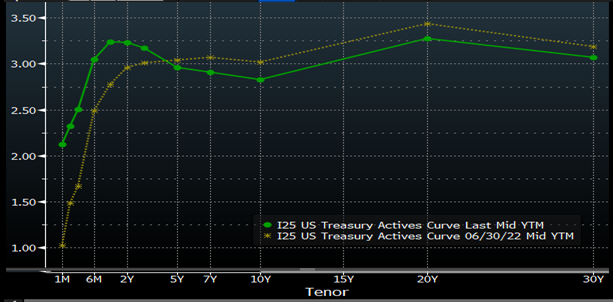
Source: Bloomberg
The chart above shows current rate in green and rates from June 30 in yellow. First thing you notice is the one-month rate is significantly higher now. This is primarily due to the larger than expected nonfarm payroll release. Leading up to this number, the markets were starting to buy into a scenario where the economy was slowing and the FOMC would not have to raise short-term rates as aggressively. Now the concern is that the rate hikes are not having an impact yet, so more are coming! The longer end of the curve, 10- to 30-year, has not moved as much with the view that inflation, while still high, has peaked.
Much has been made of the inversion of the curve from two to 10 years, as an indicator of coming recession. As you can see above, the 10-year has not moved materially, and the two-year is higher because of more FOMC short-term rate hikes. Does that mean a recession is coming? Maybe some time in the future.
Credit spreads are the rate differential between a risk-free rate and the rate where corporations can issue bonds. As you would imagine, riskier companies must pay a higher spread above UST to attract buyers. This spread is watched closely for indications of stress in company’s health. So far, these spreads are not widening; another sign in the “not in recession yet” camp.
Decision time
Turning to equities, we are in a bear market. That much is obvious. The question is, when will we come out of it? We have never seen a bear market end before the recession began. Period.
So, we have several possible scenarios. One, the recession has already begun, and stocks bottomed in June. Two, the recession has not started yet and a new low in stocks is still to come. Three, the Fed will engineer a soft landing and the bear market ended in June. Four, it's different this time, and the bear market is over before the recession begins.
Wrap-up
Recession or not yet? The markets and indicators are not giving a clear signal. Pay attention to the environment around you. Are people changing behaviors or are they walking around with their hands in the air like they just don’t care? The U.S. economy still has a lot of strength and will power through this — it's all a matter of timing.
| Upcoming Economic Releases: | Period | Expected | Previous | |
|---|---|---|---|---|
| 9-Aug | NFIB Small Business Optimism | Jul | 89.3 | 89.5 |
| 9-Aug | Nonfarm Productivity | Q2 | -4.5% | -7.3% |
| 9-Aug | Unit Labor Costs | Q2 | 9.8% | 12.6% |
| 10-Aug | Consumer Price Index MoM | Jul | 0.2% | 1.3% |
| 10-Aug | CPI ex Food & Energy MoM | Jul | 0.5% | 0.7% |
| 10-Aug | Consumer Price Index YoY | Jul | 8.7% | 9.1% |
| 10-Aug | CPI ex Food & Energy YoY | Jul | 6.1% | 5.9% |
| 10-Aug | Real Avg Hourly Earnings YoY | Jul | N/A | -3.6% |
| 10-Aug | Wholesale Inventories MoM | Jun | 1.9% | 1.9% |
| 11-Aug | Initial Jobless Claims | 6-Aug | 263,000 | 260,000 |
| 11-Aug | Continuing Claims | 30-Jul | 1,405,000 | 1,416,000 |
| 11-Aug | Producer Price Index MoM | Jul | 0.3% | 1.1% |
| 11-Aug | PPI ex Food & Energy MoM | Jul | 0.4% | 0.4% |
| 11-Aug | Producer Price Index YoY | Jul | 10.3% | 11.3% |
| 11-Aug | PPI ex Food & Energy YoY | Jul | 7.8% | 8.2% |
| 12-Aug | UM (Go MSU) Consumer Sentiment | Aug | 52.0 | 51.5 |
| 12-Aug | UM (Go MSU) Current Conditions | Aug | N/A | 58.1 |
| 12-Aug | UM (Go MSU) Expectations | Aug | 48.5 | 47.3 |
| 12-Aug | UM (Go MSU) 1-year inflation | Aug | N/A | 5.2% |
| 12-Aug | UM (Go MSU) 5- to10-year inflation | Aug | N/A | 2.9% |
Steve Orr is the Executive Vice President and Chief Investment Officer for Texas Capital Bank Private Wealth Advisors. Steve has earned the right to use the Chartered Financial Analyst and Chartered Market Technician designations. He holds a Bachelor of Arts in Economics from The University of Texas at Austin, a Master of Business Administration in Finance from Texas State University, and a Juris Doctor in Securities from St. Mary’s University School of Law. Follow him on Twitter here.
Mark Frears is an Investment Advisor at Texas Capital Bank Private Wealth Advisors. He holds a Bachelor of Science from The University of Washington, and an MBA from University of Texas – Dallas.
The contents of this article are subject to the terms and conditions available here.