Looking for direction? — Week of February 13, 2023

Essential Economics
— Mark Frears
Directions
What would you do without Google Maps? Do you have a good sense of direction? Some of you may remember road atlases or trying to fold up a map properly. I will look at a digital map to see the overall way there, but then I’ll figure it out on my own. The markets continue to look for direction based on the expected economic picture.
Rearview mirror
Last week we had a full slate of Fed Talking Heads, following up after the previous week’s Federal Open Market Committee (FOMC) meeting and Chair Powell’s more dovish comments. They all leaned towards a hawkish stance, saying that their job was not done, and the monetary tightening would continue. Equity markets paid scant attention to this, but bond markets ramped longer term rates higher.
The only other item of note was the UM Consumer Sentiment release. The questions posed to participants are geared more toward inflation. As you can see below, the upward trend since June is a positive for the Fed’s inflation-fighting mode.
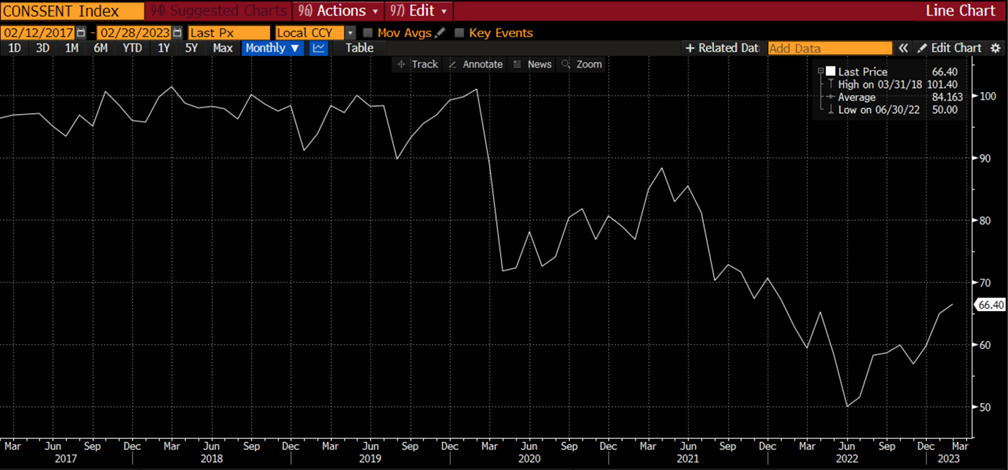
Source: Bloomberg
Windshield
As we look down the road, the big question is whether we are going on a mildly bumpy ride, a curvy potholed ride or over the cliff. The signs to keep an eye on this week will give the most recent updates on inflation, consumer spending, housing and the leading index.
The first sign to watch this week is the Consumer Price Index (CPI). The monthly changes are good to watch for near-term indications, but the markets have been focused on the year-over-year (YoY) numbers to get a better idea of trend. As you can see below, the YoY has been on a good downward trend but is still well over 6%.
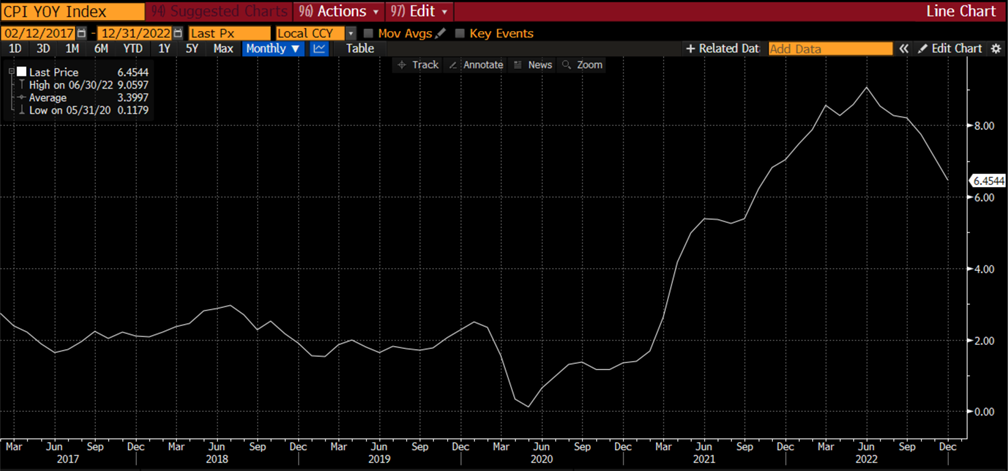
Watching the monthly numbers will show whether this trend will continue. An interesting note is that last week the Bureau of Labor Statistics revised December’s CPI to +0.1% from -0.1%, citing seasonal factors. Given higher gas and used car prices over the past month, we are expecting a monthly change of +0.5%. Will this stop the downward trend and give the Fed more ammunition for further tightening?!
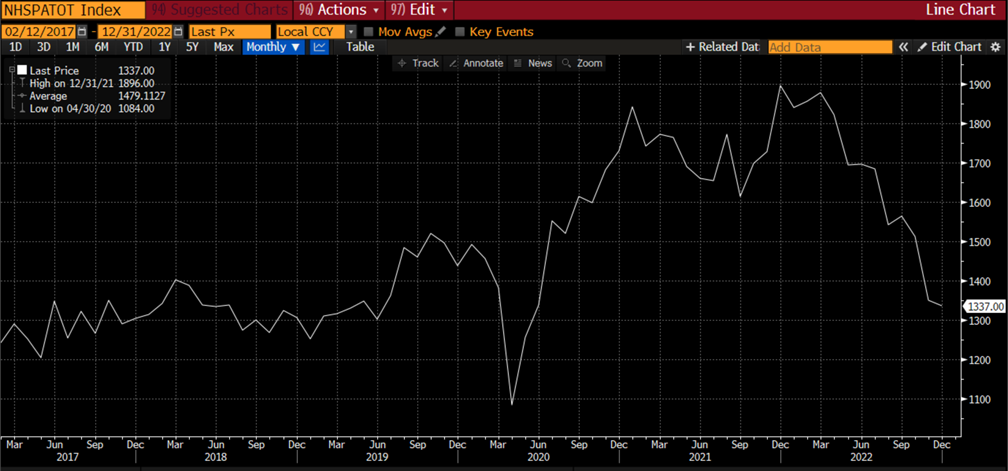
Next, we will see a truckload of housing stats. The NAHB Housing Market Index, building permits, and housing starts will give us the next glimpse into whether lower mortgage rates have helped here. Given that supply is lower than demand, while demand has slowed, home prices remain elevated. As you can see below, building permits have been in a free fall for most of this year.
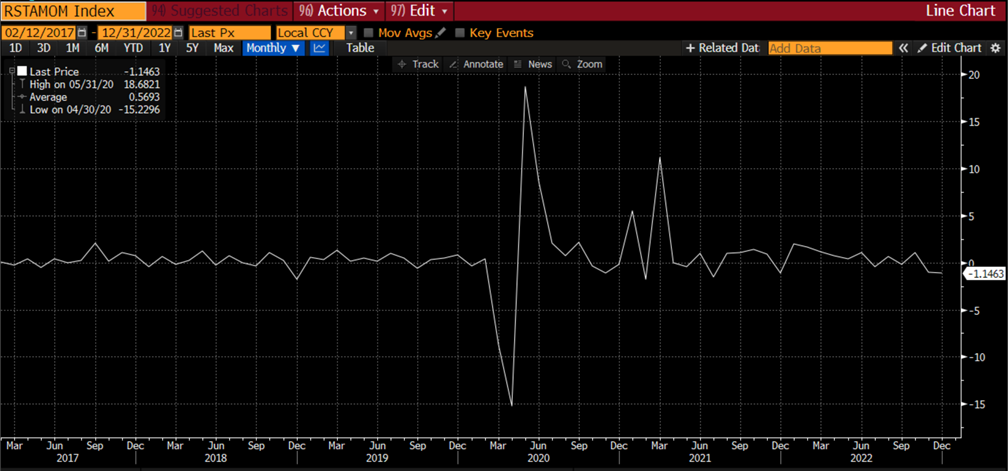
A good barometer of consumer behavior can be seen in the Retail Sales release. As you can see below, this did dip into negative territory last month, but expectations are for a strong rebound in January with consumers’ job prospects still very robust.
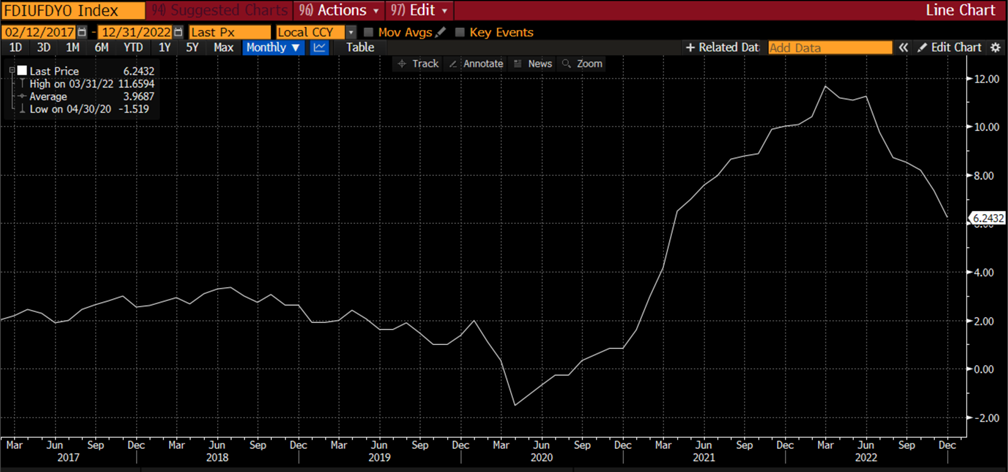
Inflation at the producer level can be an indicator of what is to come for the consumer. The Producer Price Index (PPI) is also out next week. We have seen continued improvement on a YoY basis, primarily as the cost of goods declines. The services sector is an area of concern with wages showing no signs of decreasing, given the imbalance of supply and demand in the labor market. Below we see the YoY PPI and while the downward trajectory is viewed positively, we are still well above the long-term 2% level.
The other significant sign this week is the Leading Index. The Conference Board publishes this monthly looking at variables that should change ahead of overall economic activity. This looks at financial and nonfinancial components and has been in negative since March of last year, as you can see below.
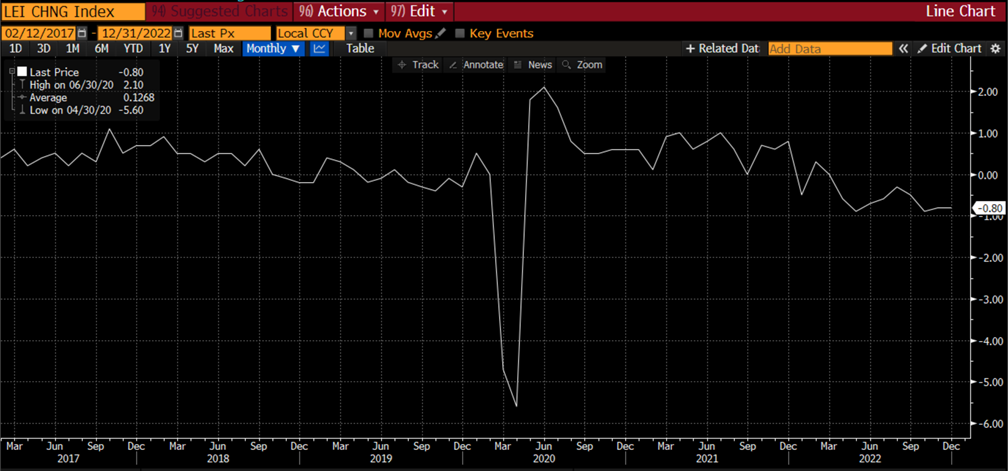
This is one of the signs that would point toward a cliff fast approaching but the markets and consumers have chosen to ignore this. We are looking for a “less negative” number this month, showing some glimmer of hope.
Takeaway
All the charts above look back in time, showing the longer term trend. This is very important to watch, instead of focusing on one month’s data. In most cases the economy is slowing, and inflation is improving, but the main point is that we have not yet reached our destination and the location is still uncertain. The Fed will continue to raise rates and once they have paused, will need to leave rates at higher levels for a time to let lag effects fully flow through.
Wrap-up
The markets continue to be like most men, ignoring directions, choosing to muddle their way to their destination. As we have several signs along the road this week, possibly that will draw attention.
| Upcoming Economic Releases: | Period | Expected | Previous | |
|---|---|---|---|---|
| 14-Feb | NFIB Small Business Optimism | Jan | 91.0 | 89.8 |
| 14-Feb | Consumer Price Index MoM | Jan | 0.5% | -0.1% |
| 14-Feb | CPI ex Food & Energy MoM | Jan | 0.4% | 0.3% |
| 14-Feb | Consumer Price Index YoY | Jan | 6.2% | 6.5% |
| 14-Feb | CPI ex Food & Energy YoY | Jan | 5.5% | 5.7% |
| 14-Feb | Real Avg Hourly Earnings YoY | Jan | N/A | -1.7% |
| 15-Feb | Empire Manufacturing | Feb | (18.0) | (32.9) |
| 15-Feb | Retail Sales MoM | Jan | 1.9% | -1.1% |
| 15-Feb | Retail Sales ex Autos MoM | Jan | 0.8% | -1.1% |
| 15-Feb | Industrial Production MoM | Jan | 0.5% | -0.7% |
| 15-Feb | Capacity Utilization | Jan | 79.1% | 78.8% |
| 15-Feb | Business Inventories | Dec | 0.3% | 0.4% |
| 15-Feb | NAHB Housing Market Index | Feb | 37 | 35 |
| 16-Feb | Building Permits | Jan | 1,350,000 | 1,330,000 |
| 16-Feb | Building Permits MoM | Jan | 1.0% | -1.6% |
| 16-Feb | Housing Starts | Jan | 1,353,000 | 1,382,000 |
| 16-Feb | Housing Starts MoM | Jan | -2.1% | -1.4% |
| 16-Feb | NY Fed Services Business Activity | Feb | N/A | (21.4) |
| 16-Feb | Initial Jobless Claims | 11-Feb | 200,000 | 196,000 |
| 16-Feb | Continuing Claims | 4-Feb | 1,688,000 | 1,688,000 |
| 16-Feb | Philadelphia Fed Business Outlook | Feb | (7.4) | (8.9) |
| 16-Feb | Producer Price Index MoM | Jan | 0.4% | -0.5% |
| 16-Feb | PPI ex Food & Energy MoM | Jan | 0.3% | 0.1% |
| 16-Feb | Producer Price Index YoY | Jan | 5.4% | 6.2% |
| 16-Feb | PPI ex Food & Energy YoY | Jan | 4.9% | 5.5% |
| 17-Feb | Import Price Index MoM | Jan | -0.1% | 0.4% |
| 17-Feb | Export Price Index MoM | Jan | -0.2% | -2.6% |
| 17-Feb | Leading Index | Jan | -0.3% | -0.8% |
Mark Frears is an Investment Advisor, Executive Vice President, at Texas Capital Bank Private Wealth Advisors. He holds a Bachelor of Science from The University of Washington, and an MBA from University of Texas – Dallas.
The contents of this article are subject to the terms and conditions available here.