Try again — stocks make 4<sup>th</sup> run at moving average — Week of January 30, 2023

| index | wtd | ytd | 1-year | 3-year | 5-year | index level |
|---|---|---|---|---|---|---|
| S&P 500 Index | 2.48 | 6.11 | -4.36 | 9.25 | 9.11 | 4,070.56 |
| Dow Jones Industrial Average | 1.81 | 2.60 | 1.57 | 7.97 | 7.31 | 33,978.08 |
| Russell 2000 Small Cap | 2.37 | 8.58 | 0.37 | 6.14 | 4.84 | 1,911.46 |
| NASDAQ Composite | 4.32 | 11.07 | -12.19 | 8.74 | 10.17 | 11,621.71 |
| MSCI Europe, Australasia & Far East | 1.15 | 8.30 | -1.21 | 4.63 | 2.46 | 2,104.05 |
| MSCI Emerging Markets | 1.57 | 10.09 | -8.91 | 1.14 | -1.06 | 1,052.46 |
| Barclays U.S. Aggregate Bond Index | 0.14 | 3.04 | -8.35 | -2.20 | 0.82 | 2,111.02 |
| Merrill Lynch Intermediate Municipal | 0.01 | 2.53 | -2.05 | -0.04 | 2.04 | 306.37 |
As of market close January 27, 2023. Returns in percent.
Strategy & Positioning
— Steve Orr & Jud Riley
Glass
Short-term positive. That’s about the best we can say today. Stock markets have made a nice Bear Cycle counterrally since their October lows. The S&P 500 has risen 14%, NASDAQ 10.8%, Europe 22% and China some 40%. Do these gains stick? History says Mostly Yes, charts say Maaaybe, and fundamentals, No!
Take the tech-led S&P 500. The current countertrend rally began on October 12 with a 2.6% spring higher. News that day cited slower inflation data beneath the headline CPI. The charts suggested oversold conditions that were ripe for a rebound. Subsequent lower prints in inflation and lower Treasury General Account balances have helped keep liquidity flowing in markets and fueled the rally. Loosening regulations on lockdowns and real estate lending in China are also spurring optimism abroad.
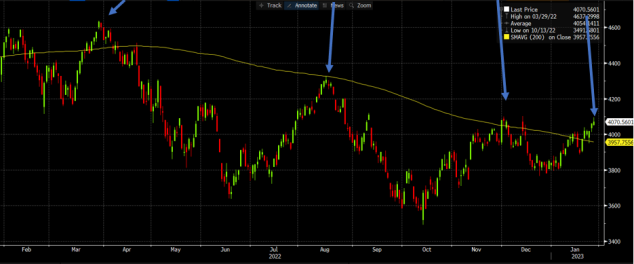
The S&P 500 peaked on December 1st. The rest of the month, all the big indices gave back much of their gains on Fed rate increase worries. First of the year fund flows and optimism over smaller rate increases got the rally back in gear. Friday’s quarter-percent rally capped a solid +2% week that put the 500, 600 Small Cap, NASDAQ and Dow Transports right back to the December 1st levels. Time for excitement? We say keep the punch in the fridge for now. The 200-day moving average for these indices could well be a glass ceiling.
Moving again
We noted recently that stocks were making a fourth run at the 200-day moving average. Most of these attacks break above the average for a couple of days and then work back down to the 200-day average. If it bounces and continues higher, that is a throwback and a bullish pattern. If it crawls below and stays below the average, that is, well, a bummer. Earnings and layoff announcements are not helping the chances for breaking out of the year-long downtrend. Here is the S&P 500 over the last year. You can see the four “humps” as the index tried to attack and break through the 200-day moving average.
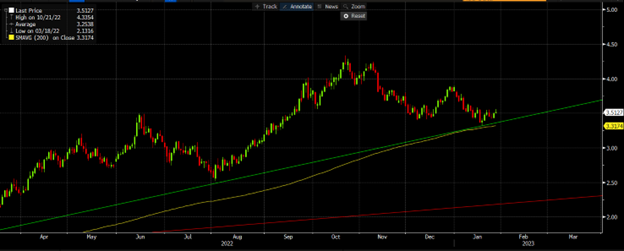
Bonds have the opposite problem. Treasury yields have climbed almost nonstop over the last year thanks to the Fed’s seven rate increases. Prospects for a slowing economy have moved yields lower since the fall. Stocks are fighting a year-long downtrend, bond yields a year-long uptrend. The wavy yellow line in the 10-year Treasury chart below is the 200-day moving average. Note how the green and red price bars have flattened out over the last few weeks. Bonds are waiting on the Fed’s meeting and Chairman Powell’s press conference on the 1st. We think the recent drop in yields is possibly a bit overdone. In relative terms, short maturities have further to rise, pending Fed rate increases. Comparable sovereign bonds such as French OATs and German Bunds are also on a higher rate trajectory.
So-so
Earnings season is starting to pick up as we head into the first week of February. Tighter monetary policy and sticky inflation are putting pressure on net profit margins, dragging earnings lower. Net profit margins are around 11.4%, below Q3 2022 and Q4 2021, which recorded 11.9% and 12.4%, respectively. Year-over-year per share earnings for the S&P 500 are down -5%. At the end of 2022, FactSet estimated the decline would be -3.2%. Seven sectors have reported lower than anticipated earnings.
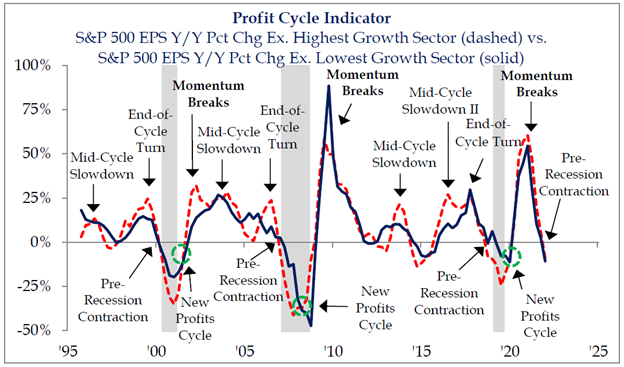
Through Friday, 71% of the S&P 500 members that reported earnings guided 2023’s first quarter earnings lower. No companies guided analysts higher. Hello somber outlook. Strategas Research tracks percentage change in profits. In the last two profit cycles when earnings growth turned this negative, recession followed (grey bars below):
Exxon and Caterpillar headline Tuesday. Profits for big oil were robust in 2022 despite lower oil prices in Q4. So far, nine out of 12 industrials sector members have beat estimates, so we will see if Caterpillar can follow suit.
Mega-tech takes over the balance of the week. Meta reports on Wednesday, followed by Google, Apple and Amazon on Thursday. Google, Meta and Amazon have announced layoffs, albeit small on percentage basis relative to number employed. Apple’s stock price has suffered due to lackluster demand for the new iPhone and higher input costs. Big tech makes up nearly a fifth of the S&P, so keep an eye on the tape as they release earnings.
What happened
Fundamentals are painting a more negative picture. Looking backwards, the fourth quarter GDP headline of 2.9% real growth looks encouraging. Unfortunately, rising inventories accounted for half of the increase: 1.46%. Rising inventories mean stuff was made but not sold. Final sales to domestic purchasers, the econo-geek number for internal U.S. activity, only increased 0.8%, its lowest since the shutdowns. Take away government and consumer spending, industrial activity was flat at +0.2%. Fourth quarter business equipment and housing fell a combined -3.2%.
Recently, Mark Frears reviewed the regional Fed bank surveys. Small businesses have a similarly sour outlook to the big S&P 500 firms that are lowering earnings estimates. Leading indicators at best point to a rolling recession in the coming months. Low unemployment claims seem to indicate that degreed individuals are having little trouble finding another job if they are let go.
Wrap-up
Companies are painting a slower growth picture for 2023. Stocks and bonds have rallied on fund flows and hopes of lower rate increases and first-of-the-year fund flows. Historical indicators like the January effect may indicate gains later in the year. For now, our indicators point to slightly overbought levels for stocks and bonds. The Fed, European Central Bank and Bank of England meet this week. We expect higher interest rates from all three central banks.
Lower earnings and more impact from rate increases mean at least a rolling recession the rest of 2023 or a stronger recession in early 2024. Housing may be bottoming. Tech layoffs suggest their recession may be next. Continued patience.
Steve Orr is the Executive Vice President and Chief Investment Officer for Texas Capital Bank Private Wealth Advisors. Steve has earned the right to use the Chartered Financial Analyst and Chartered Market Technician designations. He holds a Bachelor of Arts in Economics from The University of Texas at Austin, a Master of Business Administration in Finance from Texas State University, and a Juris Doctor in Securities from St. Mary’s University School of Law. Follow him on Twitter here.
Jud Riley is Assistant Vice President, Senior Portfolio Research Associate for Private Wealth Advisors at Texas Capital Bank. Jud has earned a Chartered Alternative Investment Analyst (CAIA) designation. Jud holds a Bachelor of Science in Economics with a Finance Application from Southern Methodist University.
The contents of this article are subject to the terms and conditions available here.