Watch out for rocks — Week of January 30, 2023

Essential Economics
— Mark Frears
Watch the flows
Have you had the amazing opportunity to go river rafting? Are you a category four or a category one person? There are times when you want an exciting ride and then there are other times you just want to float. In all cases you are looking for signs the river gives you as to how you should approach a certain section. Eddies that give you clues about underwater rocks are one place to pay attention. The money flow in the financial markets is of particular interest as well.
Levels
Money is tracked at all levels, from your spending/savings to company balance sheets, to all the money in the U.S. The consumer’s saving rate has been watched closely as it shows how much we have in reserve to handle loss of jobs or unforeseen events. In the view of many economists, this excess savings has been used up and consumers are no longer in good shape to handle a slowdown. Companies also can keep cash reserves at higher levels if they expect an economic downturn.
The overall supply of money in the U.S. is an important metric to watch, although it has fallen out of fashion lately. The Thursday afternoon release of Money Supply used to be as popular as Payroll numbers, Consumer Price Index and Gross Domestic Product.
Definitions
Money supply is defined as safe assets that households and businesses use for transactions and hold as short-term investments. The traditional classifications are:
M1 — all currency held by the public and transaction deposits at banks
M2 — M1 plus savings deposits, time deposits less than $100,000 and retail money market mutual fund shares
M2 is considered the metric to watch as it is a broad measure of cash that can be readily used. The chart below shows money supply going back to 1980.
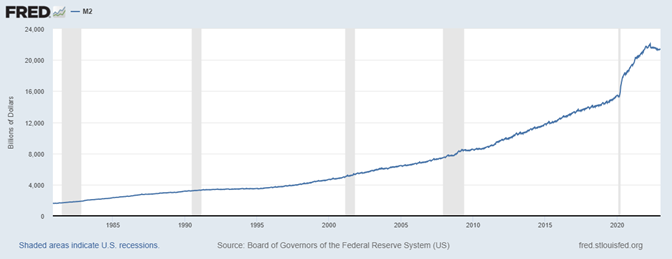
We can safely say that there is a lot of money out there!
The other important metric to monitor around money supply is the velocity. This is the speed of money — how often it is used to purchase domestic goods and services in each period. Generally, if this is increasing, more money is being spent, indicating a vibrant economy.
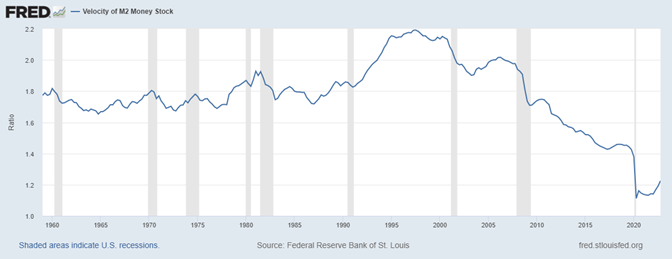
As you can see, in recessions the velocity decreases. The most recent data in this graph is for fourth quarter 2022 and velocity was on an upturn, although we are at historically low levels.
M2 growth
While we know we are at high levels of money supply, the trend that is catching the market’s attention is the speed of M2 growth or decline. This is not how fast money is moving, making transactions, but the trend in how much money is outstanding. The graph below shows M2 change on a year-over-year basis.
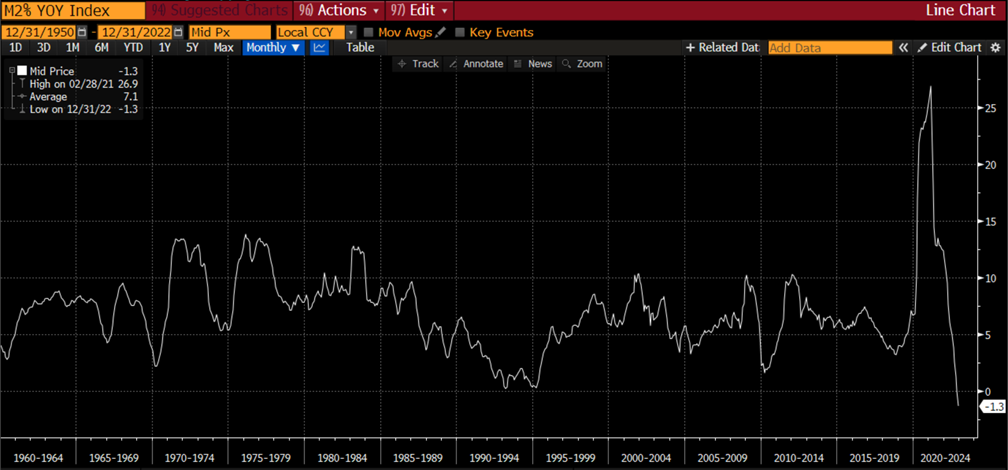
The highlight here is, going back to 1960, we have never seen a month with negative year-over-year growth like we had in December 2022.
Takeaways
The unprecedented growth in money supply is a direct impact of government stimulus. Coming out of the great recession, the Fed was actively undergoing Quantitative Easing by buying U.S. Treasury debt and mortgage-backed securities from the market, supplying cash as a means of stimulating the economy out of slow growth. The more recent spike is due to pandemic aid supplied to the public.
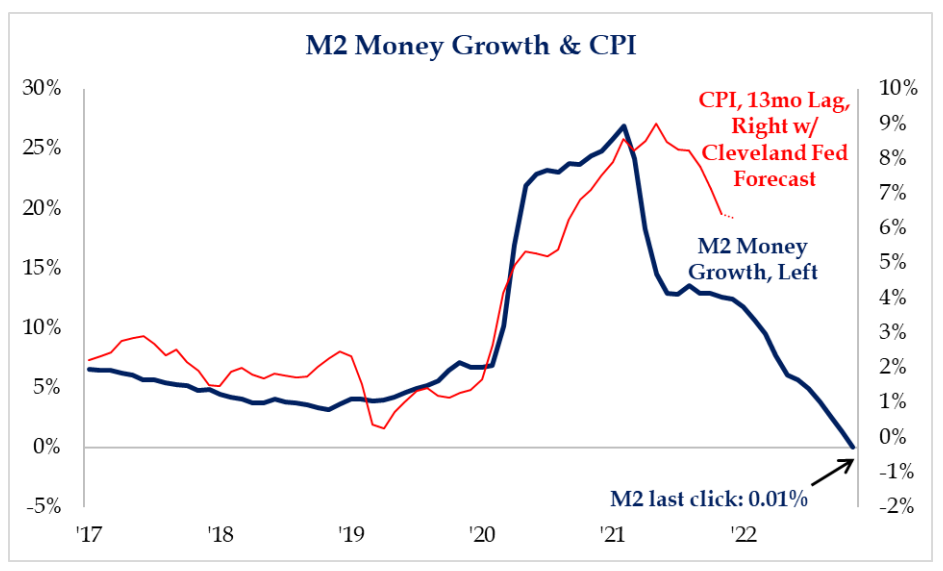
In case you forgot, the definition of inflation is too much money chasing too few goods. The 40+% increase in M2 is directly correlated to 40-year highs of inflation. While we have seen the peak (see below) in inflation, the services sector (wages) is still a concern.
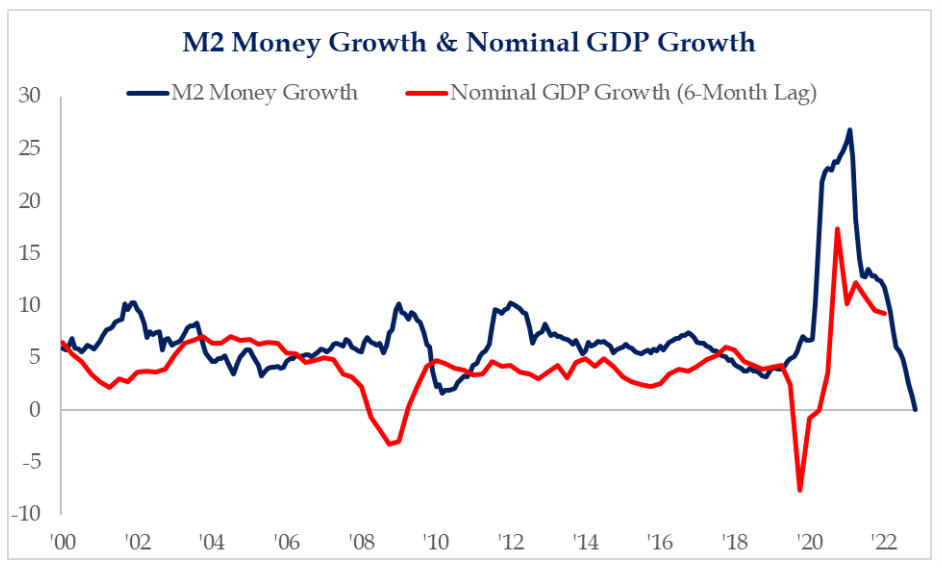
As we know, the Fed’s task is twofold, price control and maximum employment. They are making good progress on the price front, but the remaining question is whether we are in for a soft or hard landing from an economic growth perspective. The graph below shows the risk of further downtrend in Gross Domestic Product (GDP) in spite of the good news we are starting to see.
Bottom line, don’t lose sight of M2 as it can provide very important clues as to what is coming.
Economic news
As Steve Orr and Jud Riley mentioned in their comments, we had some positive releases last week. This week we have the Fed meeting announcement on Wednesday, and they will be singing from the same songbook — they are not done. The market expects them to be done raising rates sooner. This will cause some angst. In addition, we have important labor metrics like ADP, JOLTS, Claims, Payroll and Average Hourly Earnings. Will these give the Fed comfort that the labor market is not as tight? Stay tuned.
Wrap-up
Flows of money, like the flow of a river, are essential to monitor if you don’t want to get wet.
| Upcoming Economic Releases: | Period | Expected | Previous | |
|---|---|---|---|---|
| 30-Jan | Dallas Fed Manufacturing Activity | Jan | (15.0) | (18.8) |
| 31-Jan | Employment Cost Index | Q4 | 1.1% | 1.2% |
| 31-Jan | FHFA House Price Index MoM | Nov | -0.5% | 0.0% |
| 31-Jan | S&P 20-City YoY NSA | Nov | 6.65% | 8.64% |
| 31-Jan | MNI Chicago PMI | Jan | 45.0 | 44.9 |
| 31-Jan | Conference Bd Consumer Confidence | Jan | 109.0 | 108.3 |
| 31-Jan | Conference Bd Present Situation | Jan | N/A | 147.2 |
| 31-Jan | Conference Bd Expectations | Jan | N/A | 82.4 |
| 31-Jan | Dallas Fed Services Activity | Jan | N/A | N/A |
| 1-Feb | MBA Mortgage Applications | 27-Jan | N/A | 7.0% |
| 1-Feb | ADP Employment Change | Jan | 170,000 | 235,000 |
| 1-Feb | S&P Global US Manufacturing PMI | Jan | 46.8 | 46.8 |
| 1-Feb | Construction Spending MoM | Dec | 0.0% | 0.2% |
| 1-Feb | ISM Manufacturing | Jan | 48.0 | 48.4 |
| 1-Feb | ISM Prices Paid | Jan | 41.8 | 39.4 |
| 1-Feb | ISM Employment | Jan | N/A | 51.4 |
| 1-Feb | ISM New Orders | Jan | N/A | 45.2 |
| 1-Feb | JOLTS Job Openings | Dec | 10,293,000 | 10,458,000 |
| 1-Feb | FOMC Rate Decision (Lower Bound) | 1-Feb | 4.50% | 4.25% |
| 1-Feb | FOMC Rate Decision (Upper Bound) | 1-Feb | 4.75% | 4.50% |
| 2-Feb | Challenger Job Cuts YoY | Jan | N/A | 129.1% |
| 2-Feb | Unit Labor Costs | Q4 | 1.5% | 2.4% |
| 2-Feb | Nonfarm Productivity | Q4 | 2.4% | 0.8% |
| 2-Feb | Initial Jobless Claims | 28-Jan | 200,000 | 186,000 |
| 2-Feb | Continuing Claims | 21-Jan | 1,687,000 | 1,675,000 |
| 2-Feb | Factory Orders | Dec | 2.3% | -1.8% |
| 3-Feb | Change in Nonfarm Payroll | Jan | 185,000 | 223,000 |
| 3-Feb | Change in Private Payrolls | Jan | 185,000 | 220,000 |
| 3-Feb | Unemployment Rate | Jan | 3.6% | 3.5% |
| 3-Feb | Average Hourly Earnings MoM | Jan | 0.3% | 0.3% |
| 3-Feb | Labor Force Participation Rate | Jan | 62.3% | 62.3% |
| 3-Feb | Underemployment Rate | Jan | N/A | 6.5% |
| 3-Feb | S&P Global US Services PMI | Jan | 46.6 | 46.6 |
| 3-Feb | S&P Global US Composite PMI | Jan | N/A | 46.6 |
| 3-Feb | ISM Services Index | Jan | 50.5 | 49.6 |
| 3-Feb | ISM Services Employment | Jan | N/A | 49.8 |
| 3-Feb | ISM Services New Orders | Jan | N/A | 45.2 |
| 3-Feb | ISM Services Prices Paid | Jan | N/A | 67.6 |
Mark Frears is an Investment Advisor, Executive Vice President, at Texas Capital Bank Private Wealth Advisors. He holds a Bachelor of Science from The University of Washington, and an MBA from University of Texas – Dallas.
The contents of this article are subject to the terms and conditions available here.